Screenshots
What the operator console looks like in use. Every image on this page was
captured from the demo stack (cargo make demo), which serves an invented
248-PC fleet from a mock backend — no NATS, no agents, no real hosts. Names,
hostnames and sign-in accounts are fiction; nothing here came from a
deployment.
Desktop captures are 1440×900, mobile 390×901.
The console is shown in English here; the Japanese edition of this page has the same shots with the interface in Japanese. The data stays Japanese in both, because the fixture is a Japanese company — widget titles, group names and check descriptions are operator-authored, so they are whatever the operator wrote, not something the interface translates.
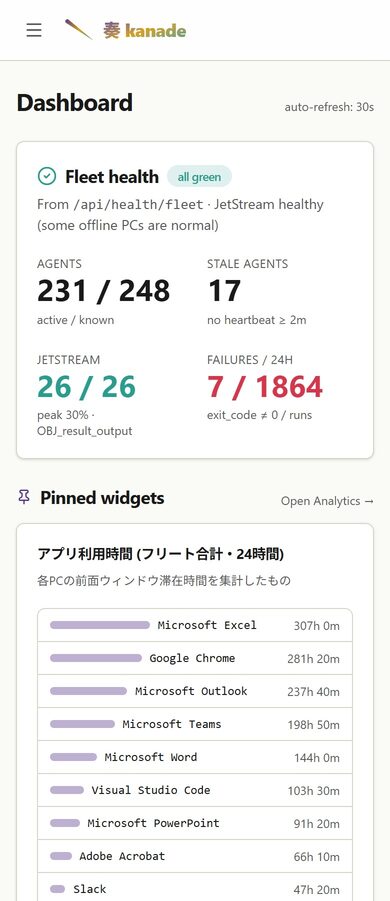
The fleet at a glance
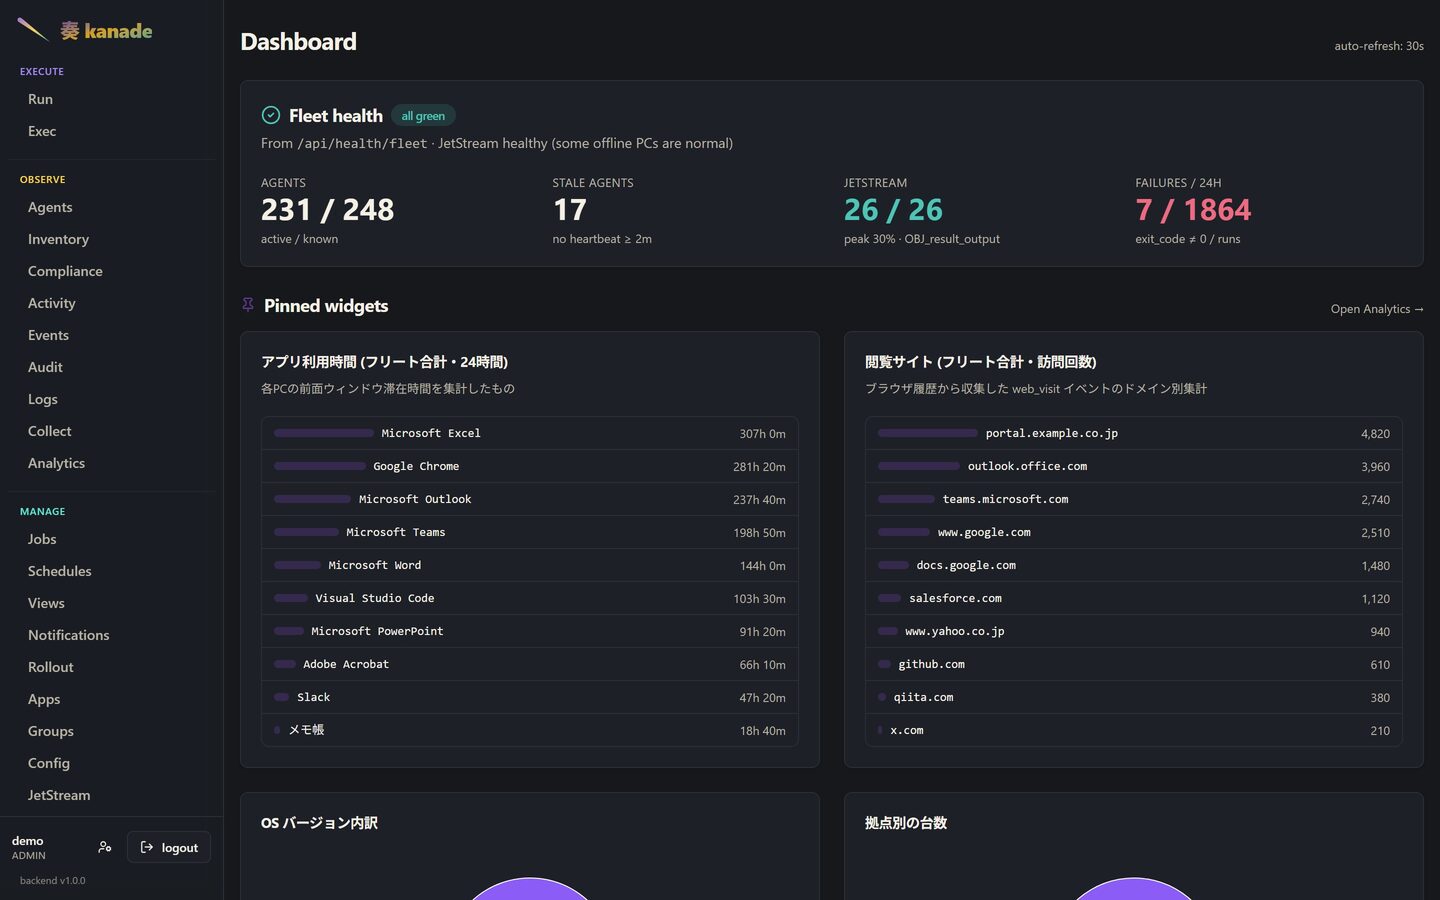
The dashboard opens on the numbers an operator checks first: how many agents are reporting, how many have gone quiet, whether the broker's streams are within their limits, and how many job runs failed in the last day. Each figure links through to the page that explains it.
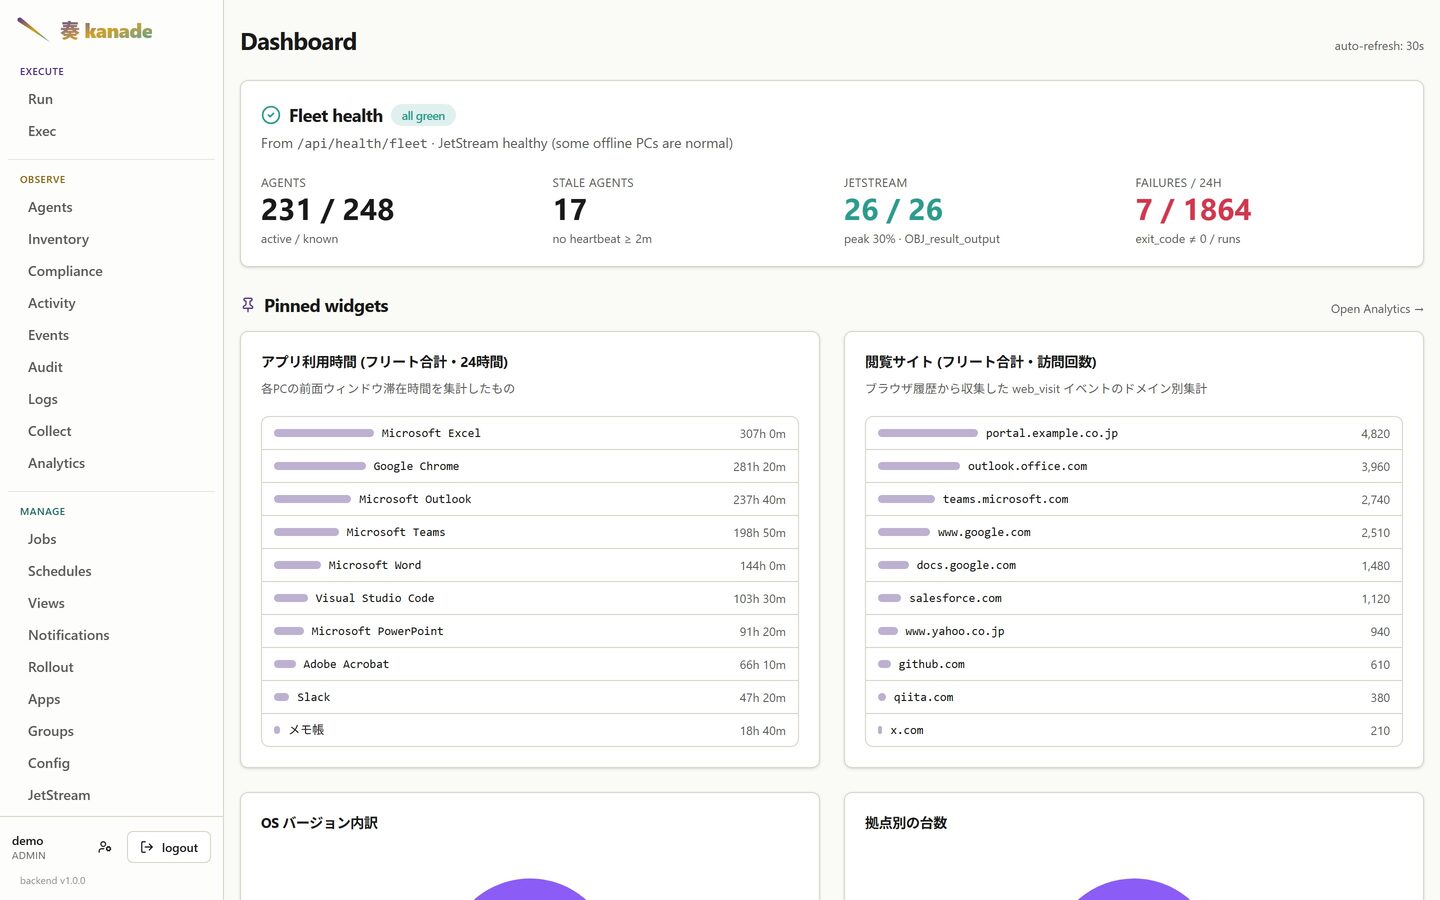
The pinned widgets below are operator-defined — they come from the same analytics views you can build yourself, pinned to the dashboard from the Analytics page.
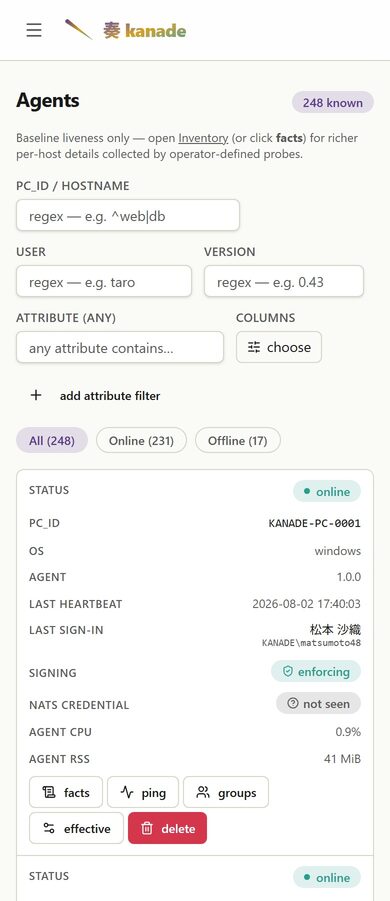
Agents
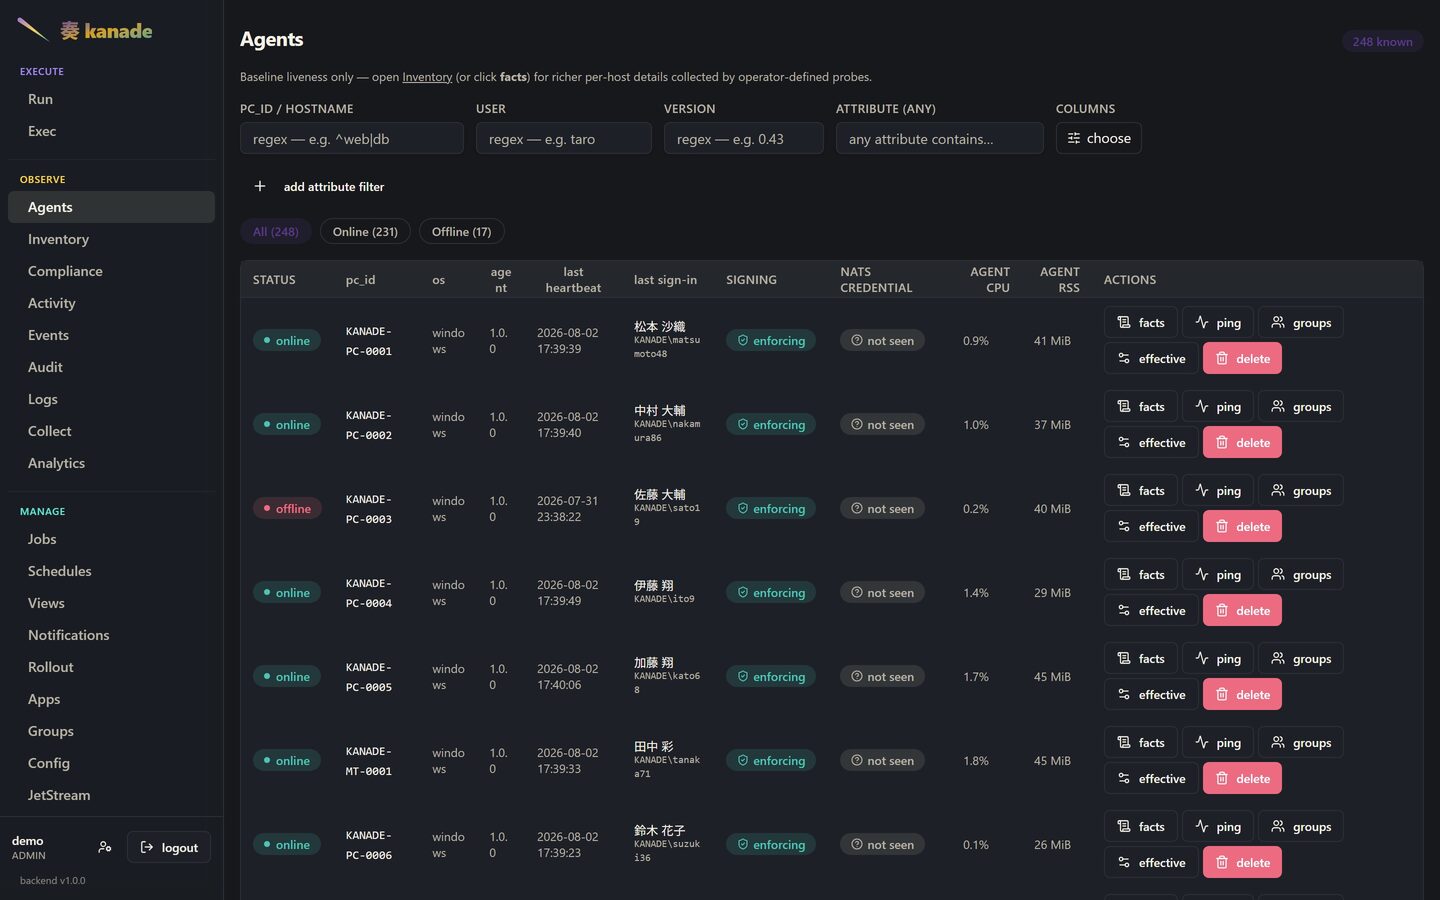
Liveness only: who is online, on which agent version, and when each host last checked in. Detail belongs to Inventory; this page answers "is it there".
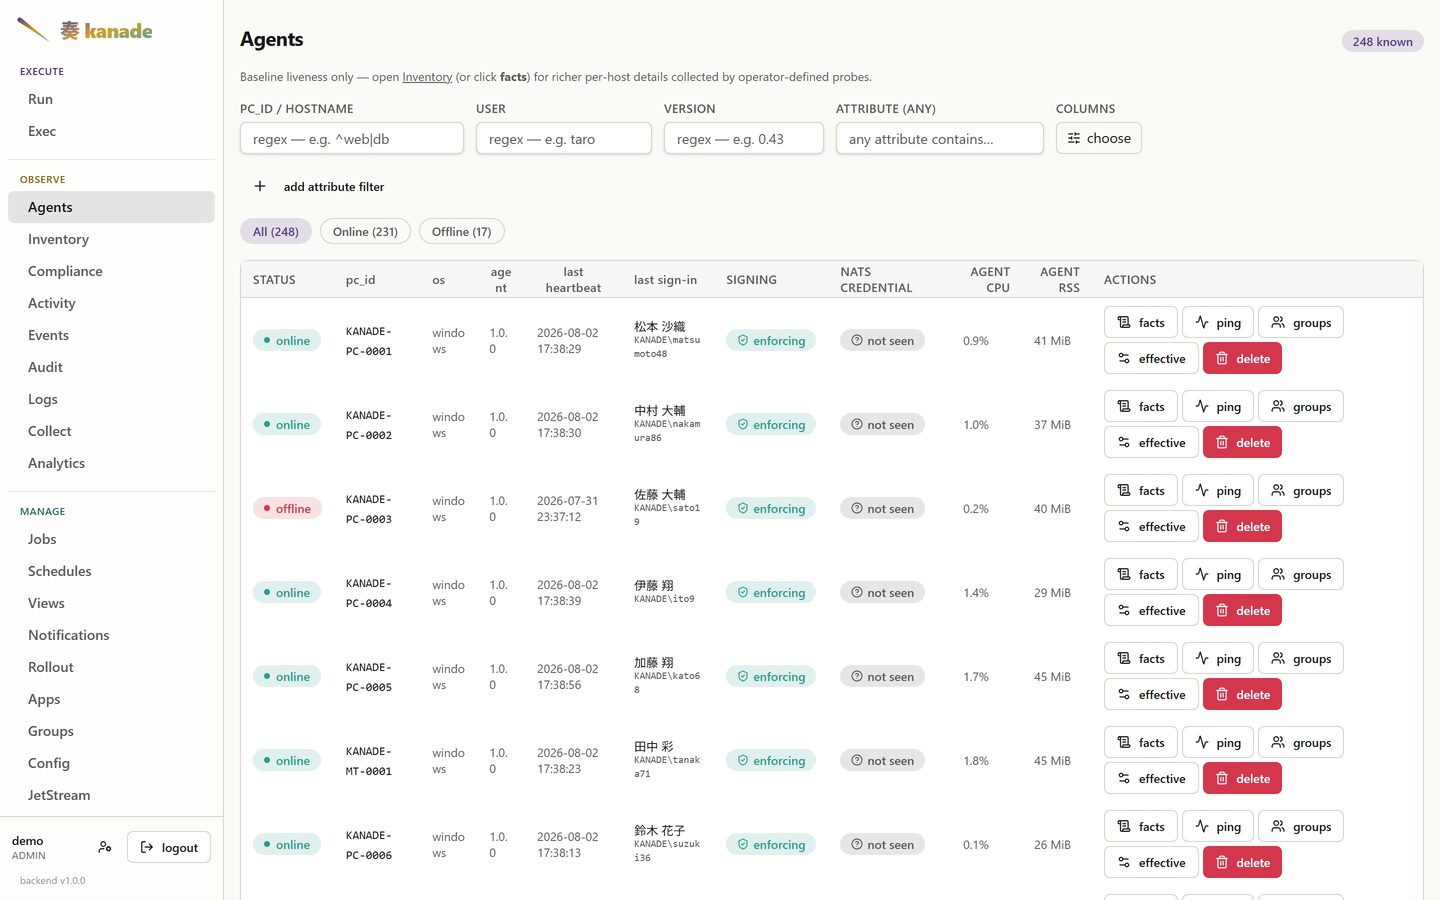
The columns are yours to choose — the shot above hides the ones this fleet does not need, which is what the columns picker is for.
One host
Opening a row gives that machine's own numbers: CPU, memory, disk and network sampled by the agent, over a window you pick. The agent measures itself too, so the chart can answer "was it the machine, or was it us".
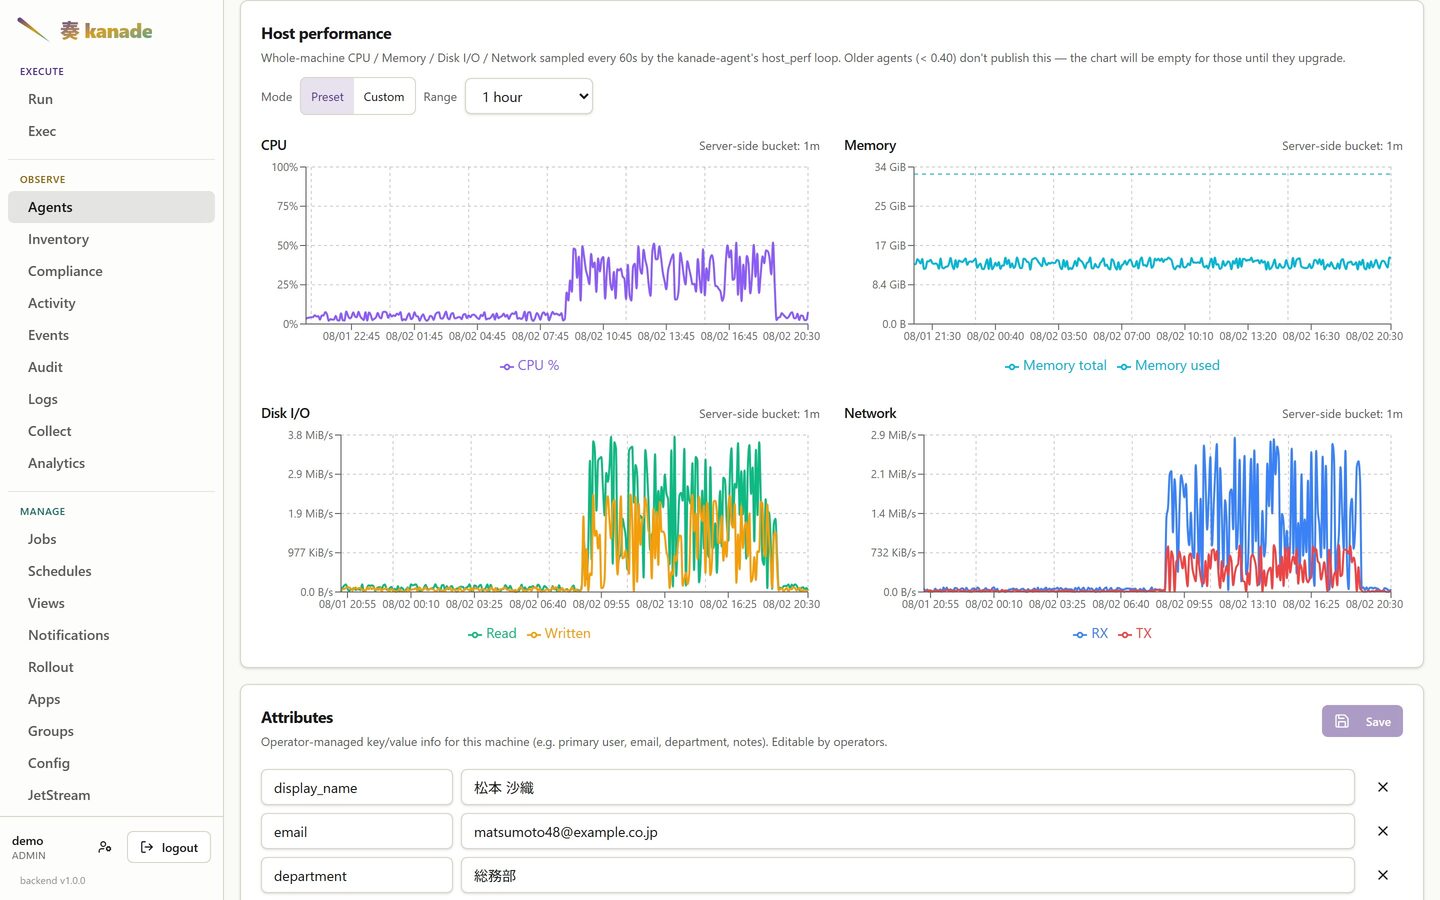
Whatever else you know about it
A machine reports what it can see about itself; it cannot know whose desk it is on or which cost centre pays for it. So every host carries a free-form key/value card an operator can edit — primary user, email, department, site, asset tag, a note about why this one is special.
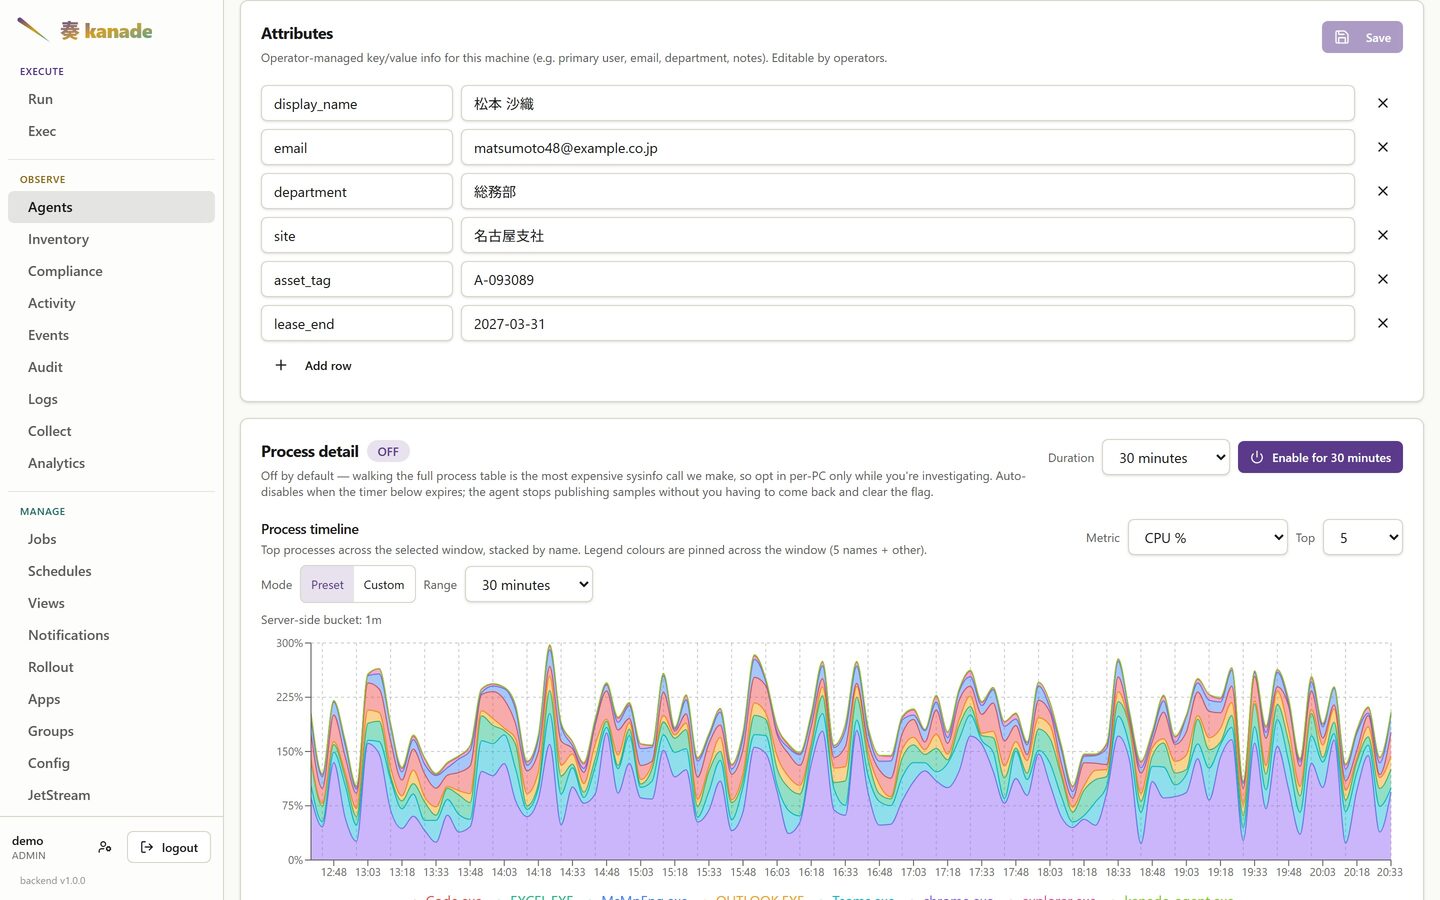
These are ordinary fields, not a fixed schema, and they are writable through
the API — which is how a directory-sync job keeps display_name and
department current without anyone typing them. Once set, they are columns
you can show and search on across the fleet.
The writes go through the backend API (kanade meta set / rm / clear, or
the per-key endpoint behind them), so they are authenticated, role-checked
(operator or above) and audited. A directory-sync job that calls
kanade meta set therefore needs a KANADE_AUTH_TOKEN even when it runs on
the backend host; it touches only its own keys, so hand-entered ones survive.
Watching the screen
Sometimes the only way to understand a report is to look. From the host's own page an operator can open its screen and watch it live.
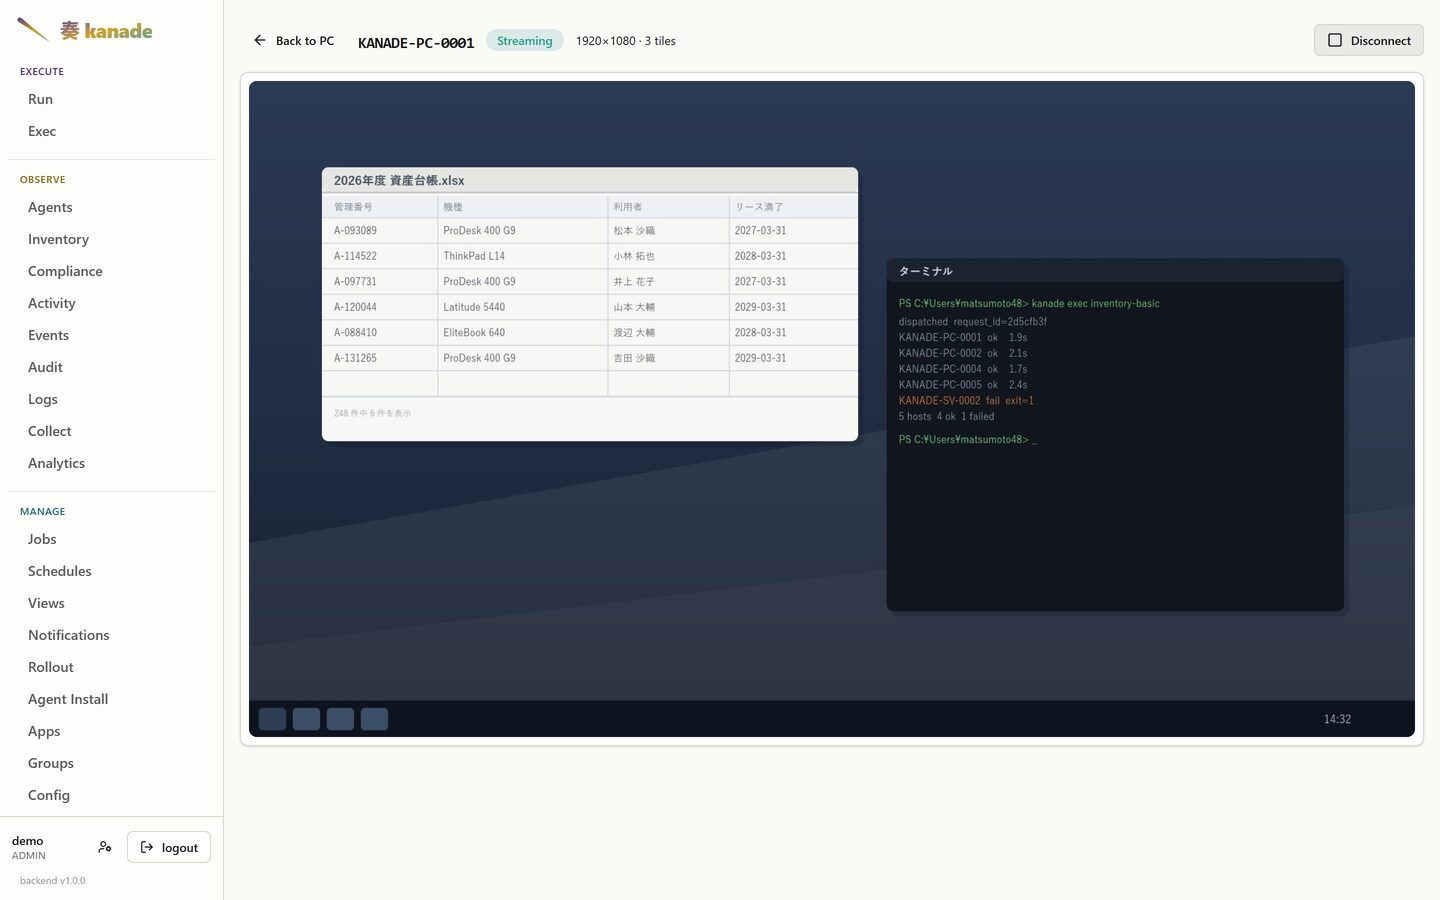
Nothing listens on the endpoint for this. The agent already holds one outbound connection, and the session rides it — so a PC behind NAT, on a branch-office line, or on someone's home wifi is reachable on exactly the same terms as one on the desk next door, with no inbound path opened to it. The header reports the desktop size and the tile count, because a session that has stopped updating should be distinguishable from one showing a screen that simply isn't changing.
The desktop above is synthetic — it is drawn by the demo stack, not captured from a machine.
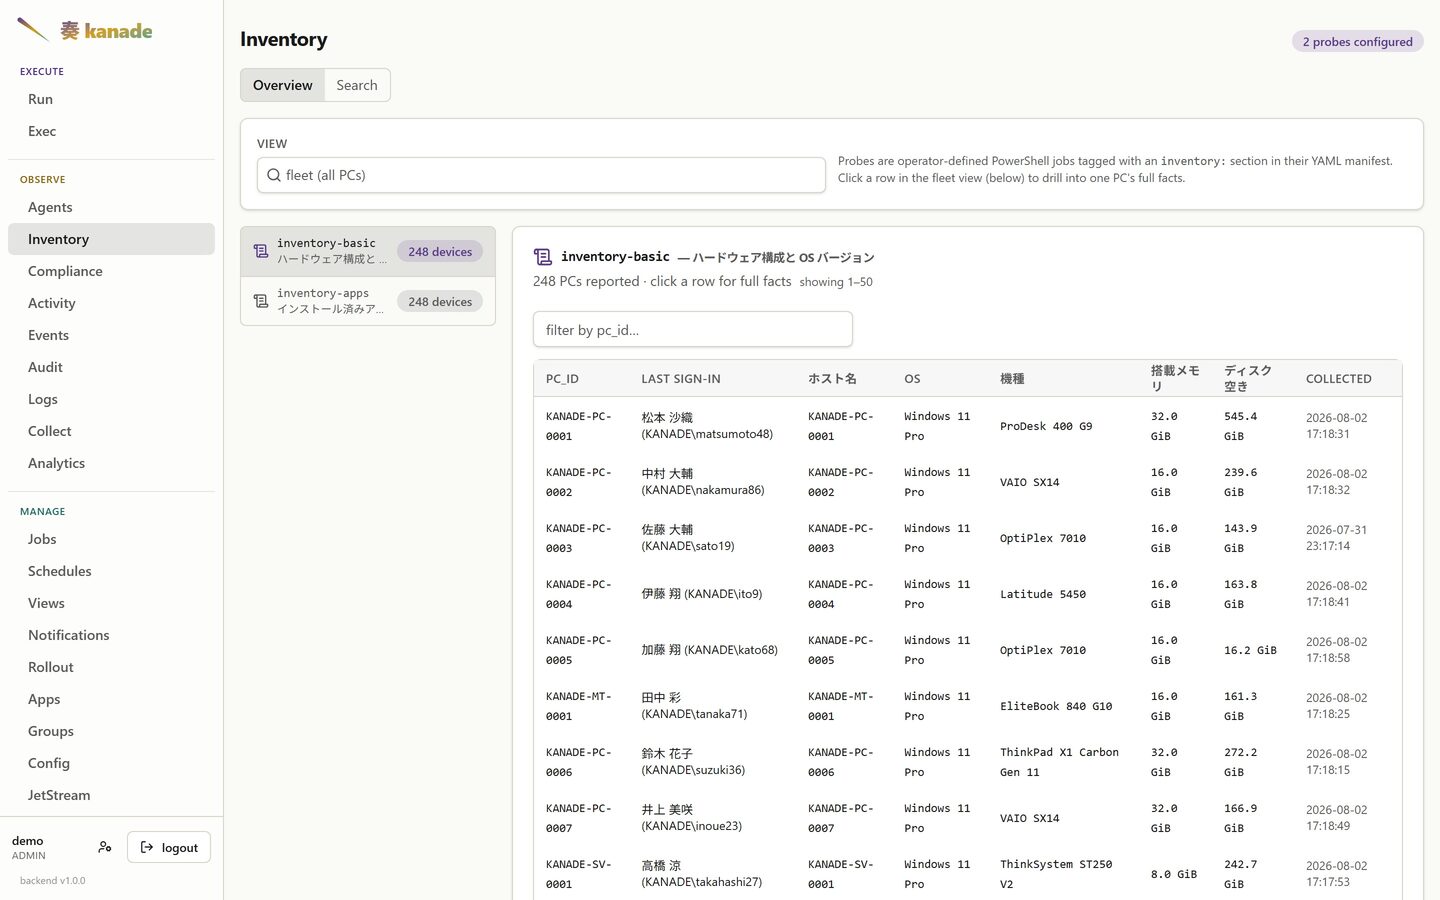
Inventory
Whatever your manifests collect. The probes are operator-authored PowerShell
tagged inventory: in a YAML job, so the columns reflect what you decided to
gather, not a fixed schema. Clicking a row opens that PC's full facts.
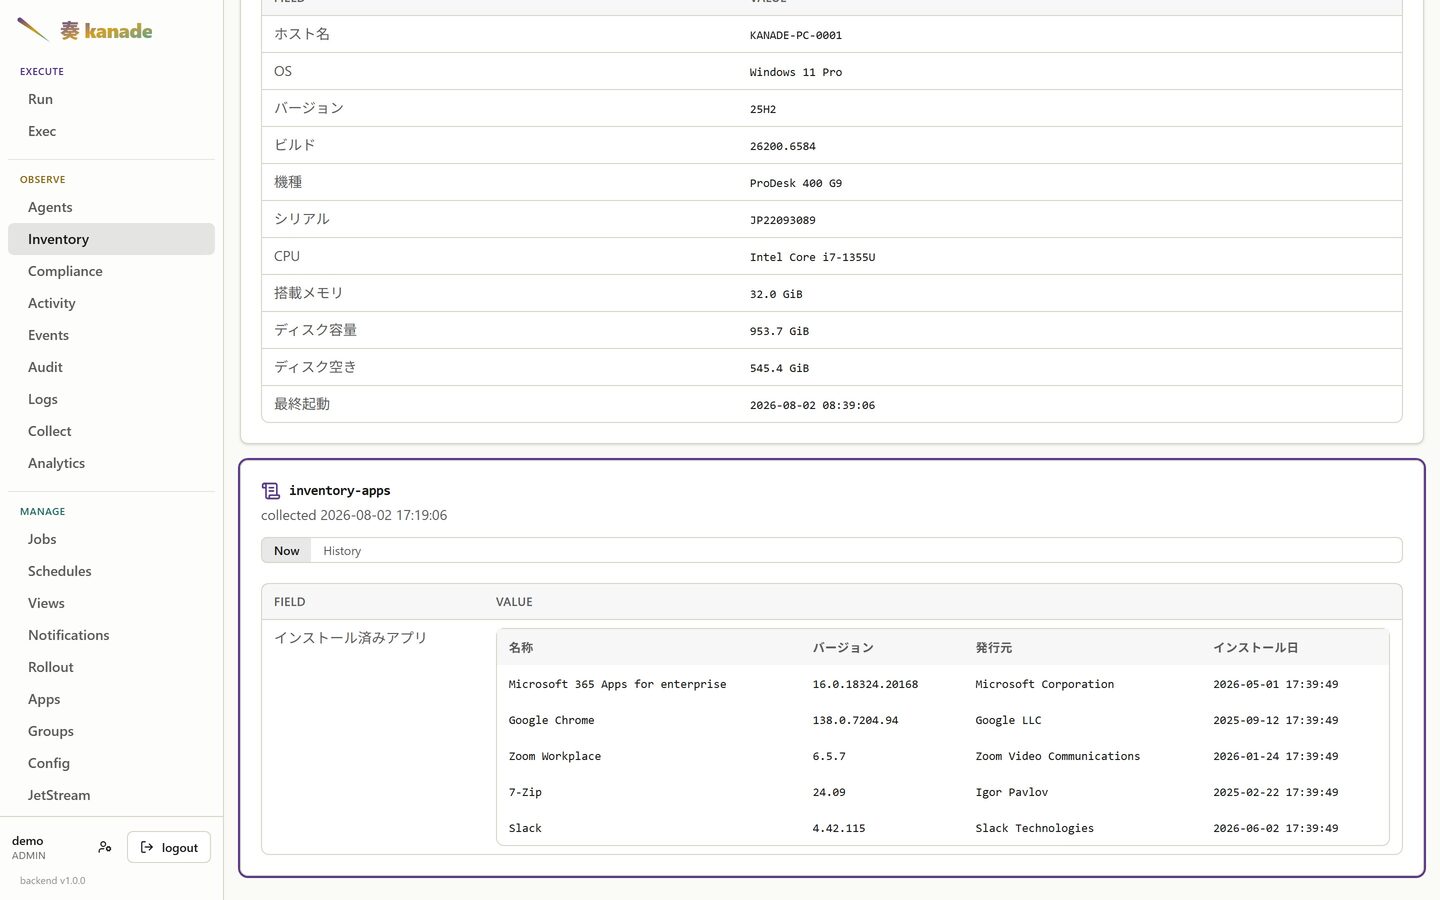
Clicking through gives every fact that PC reported, one card per probe:
What changed, and when
Each fact card has a History tab. Inventory is not only a snapshot — every run is diffed against the last one, so an installed application carries its own timeline: when it appeared, every version it moved through, and when it went away.
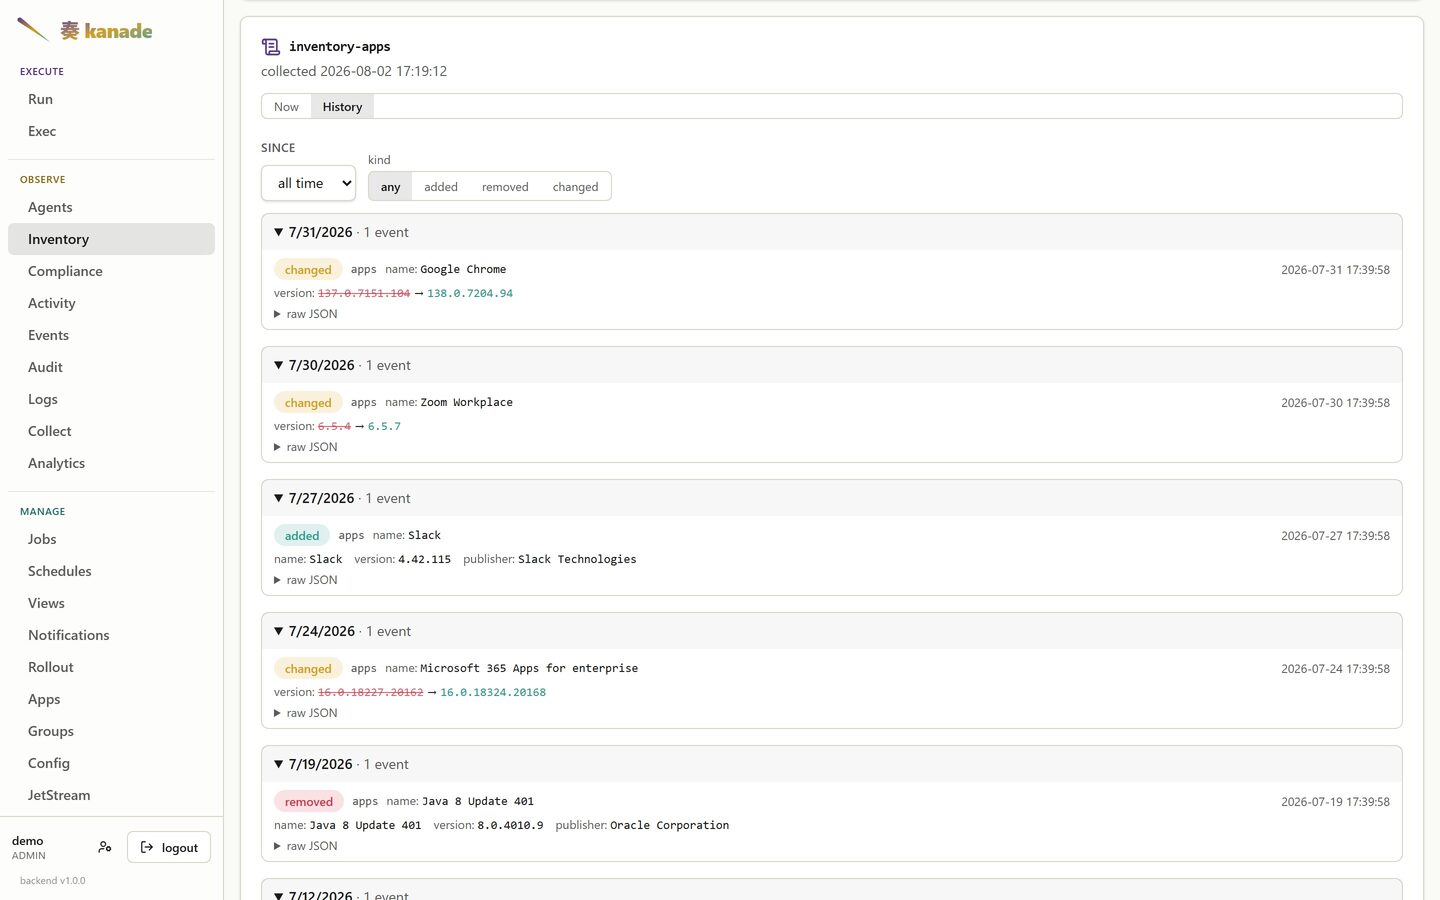
Nothing here was configured to be tracked. The probe reports a list of installed applications; the added / removed / changed rows fall out of comparing consecutive runs.
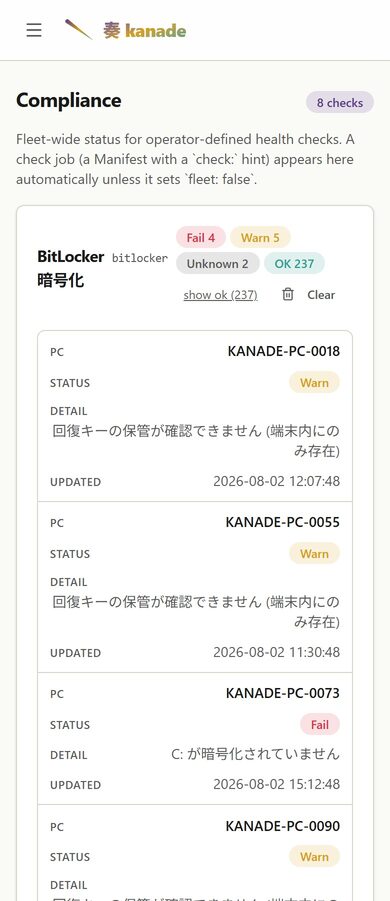
Compliance
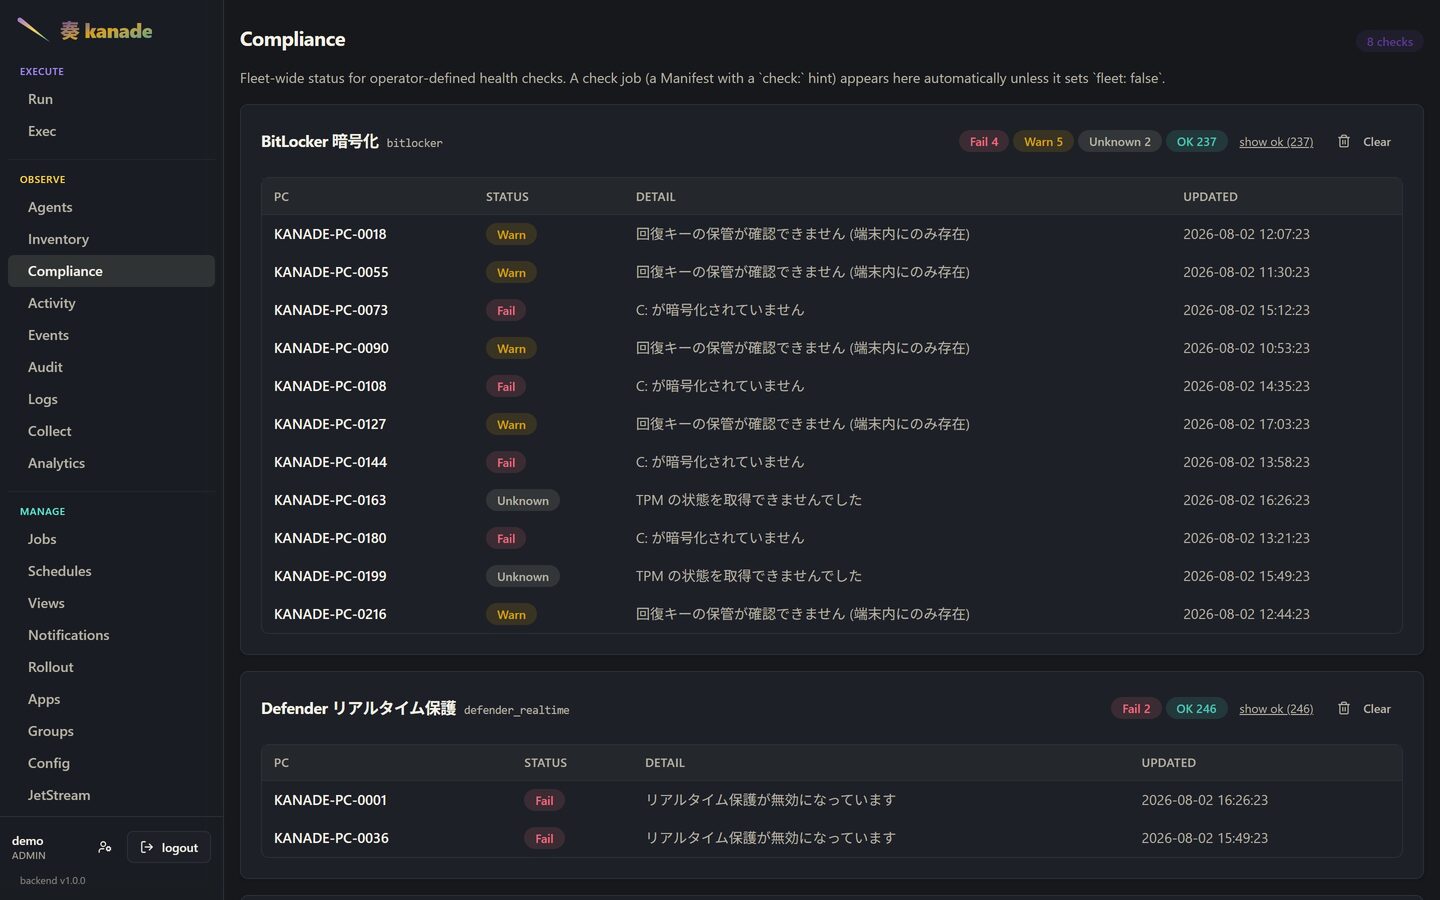
Fleet-wide status for every health check, grouped per check with its own
counts. A check is just a job carrying a check: hint, so adding one is
writing a manifest — there is no hard-coded list of things kanade knows how to
verify.
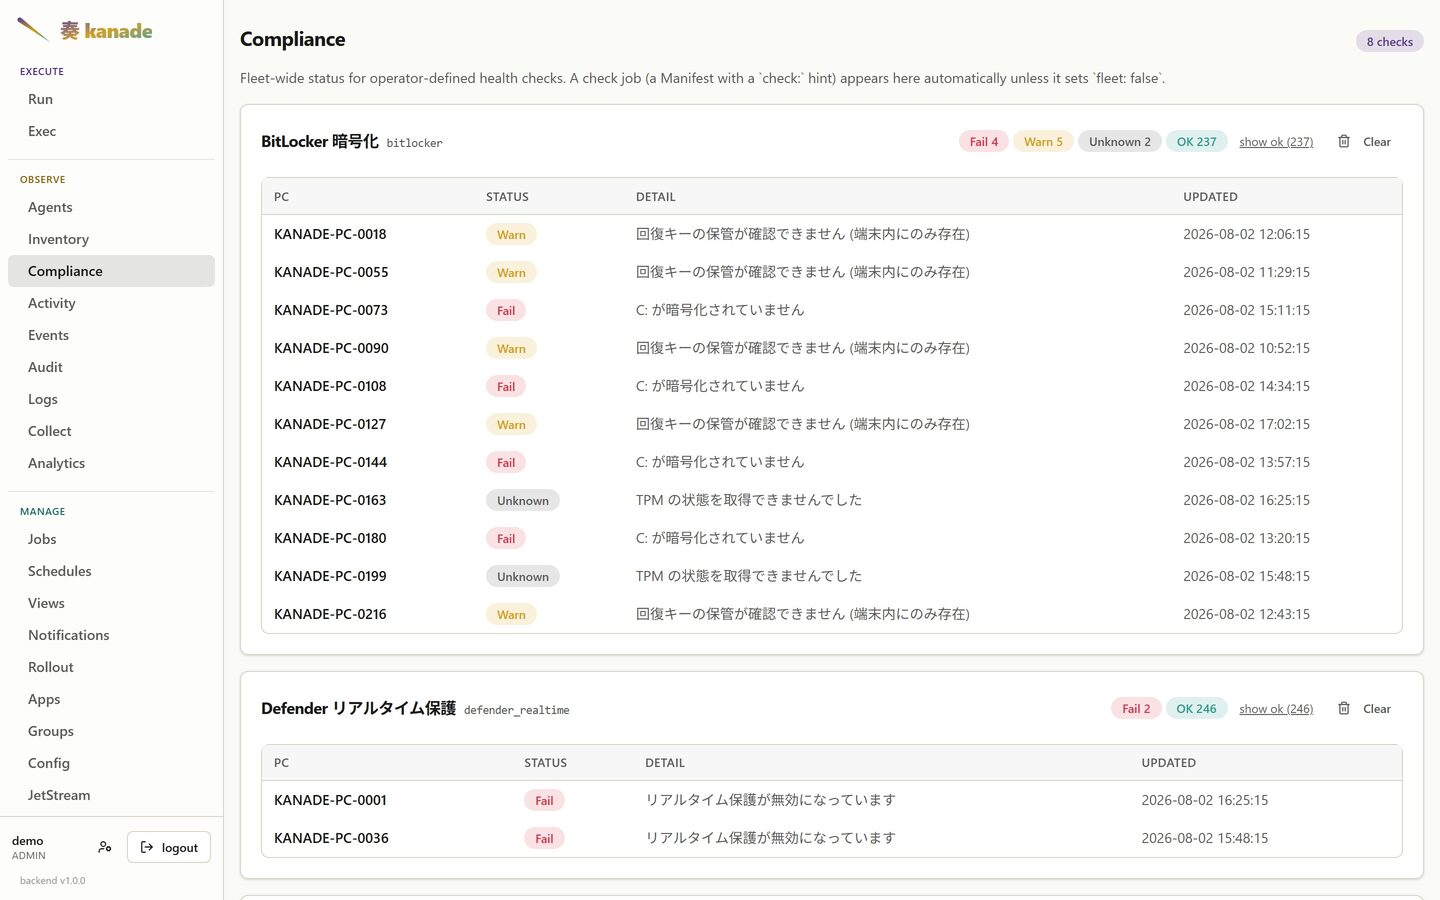
The detail column is the point: it says why a host is unhappy, in that host's own terms.
Support deadlines
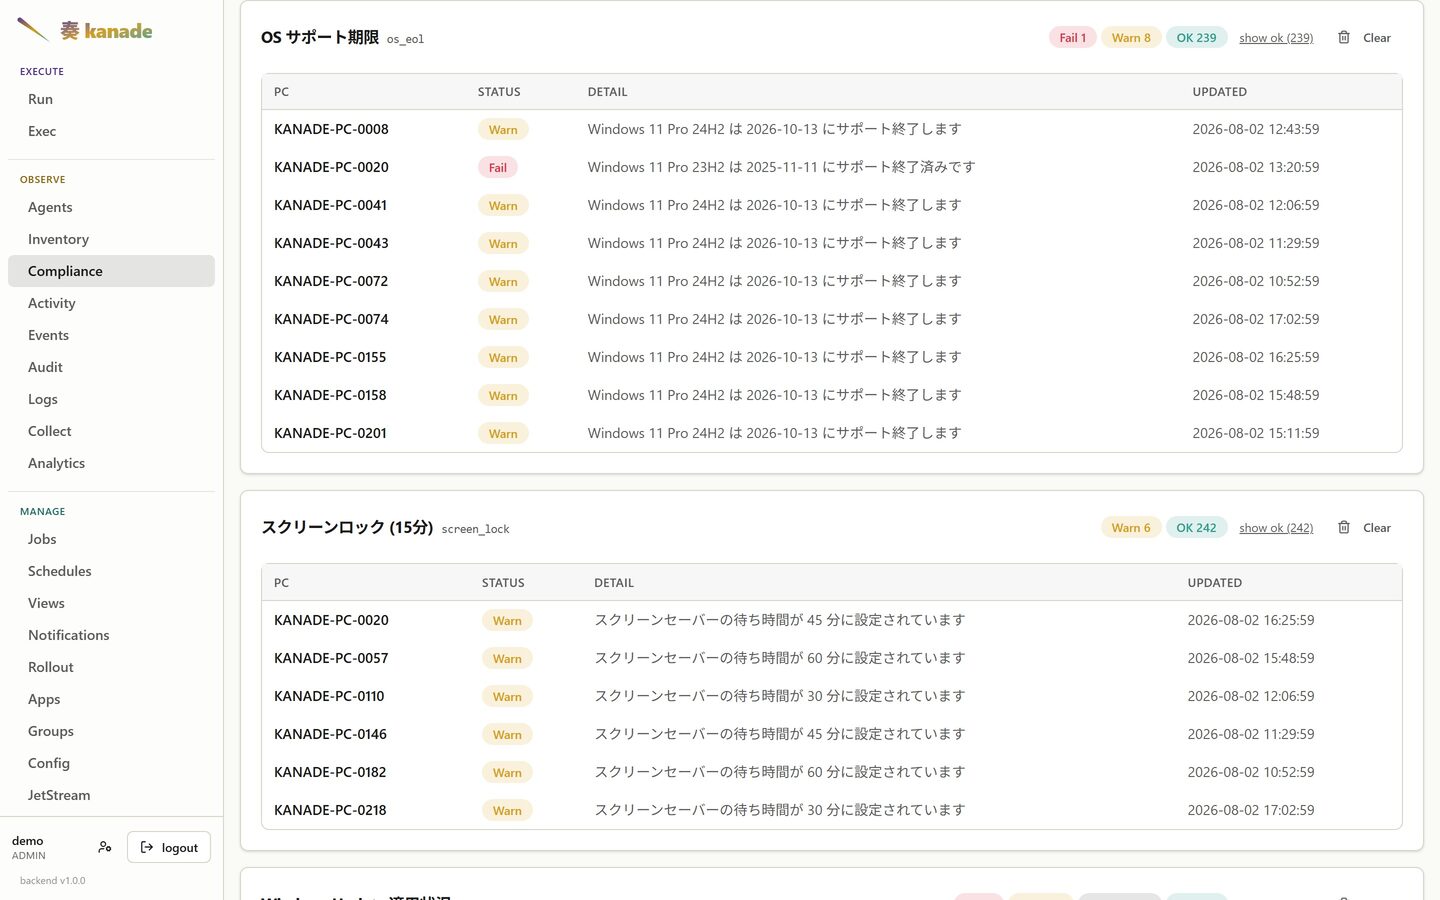
The same mechanism, pointed at dates rather than settings. This check reads each host's OS build, looks its end-of-life date up, and reports it as fail, warn or ok against how far out that date is — so a build that is fine today starts warning on its own, months before anyone would have thought to ask.
Uptime and activity
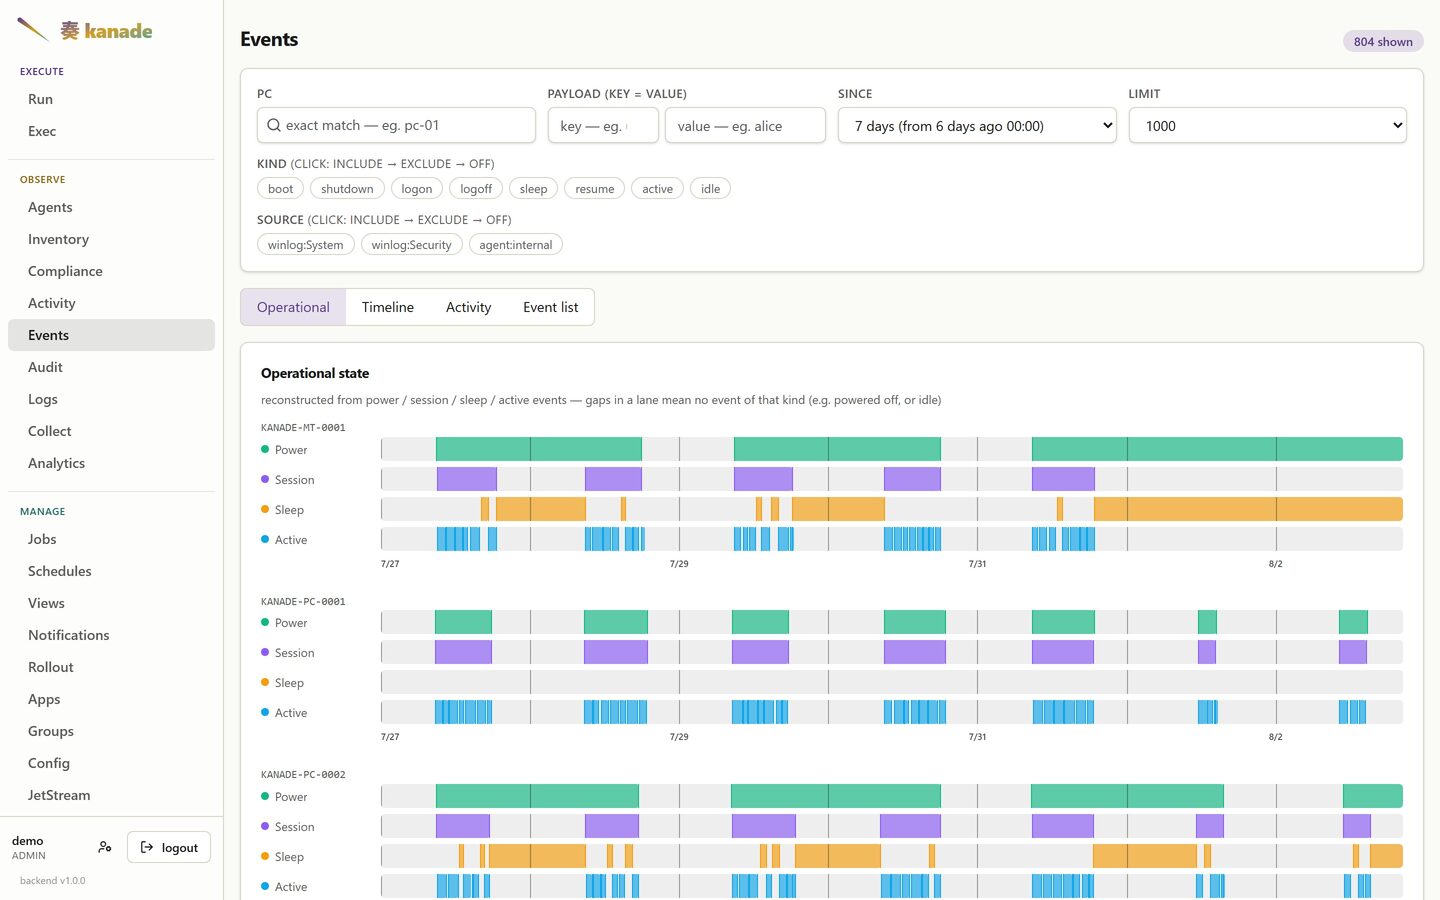
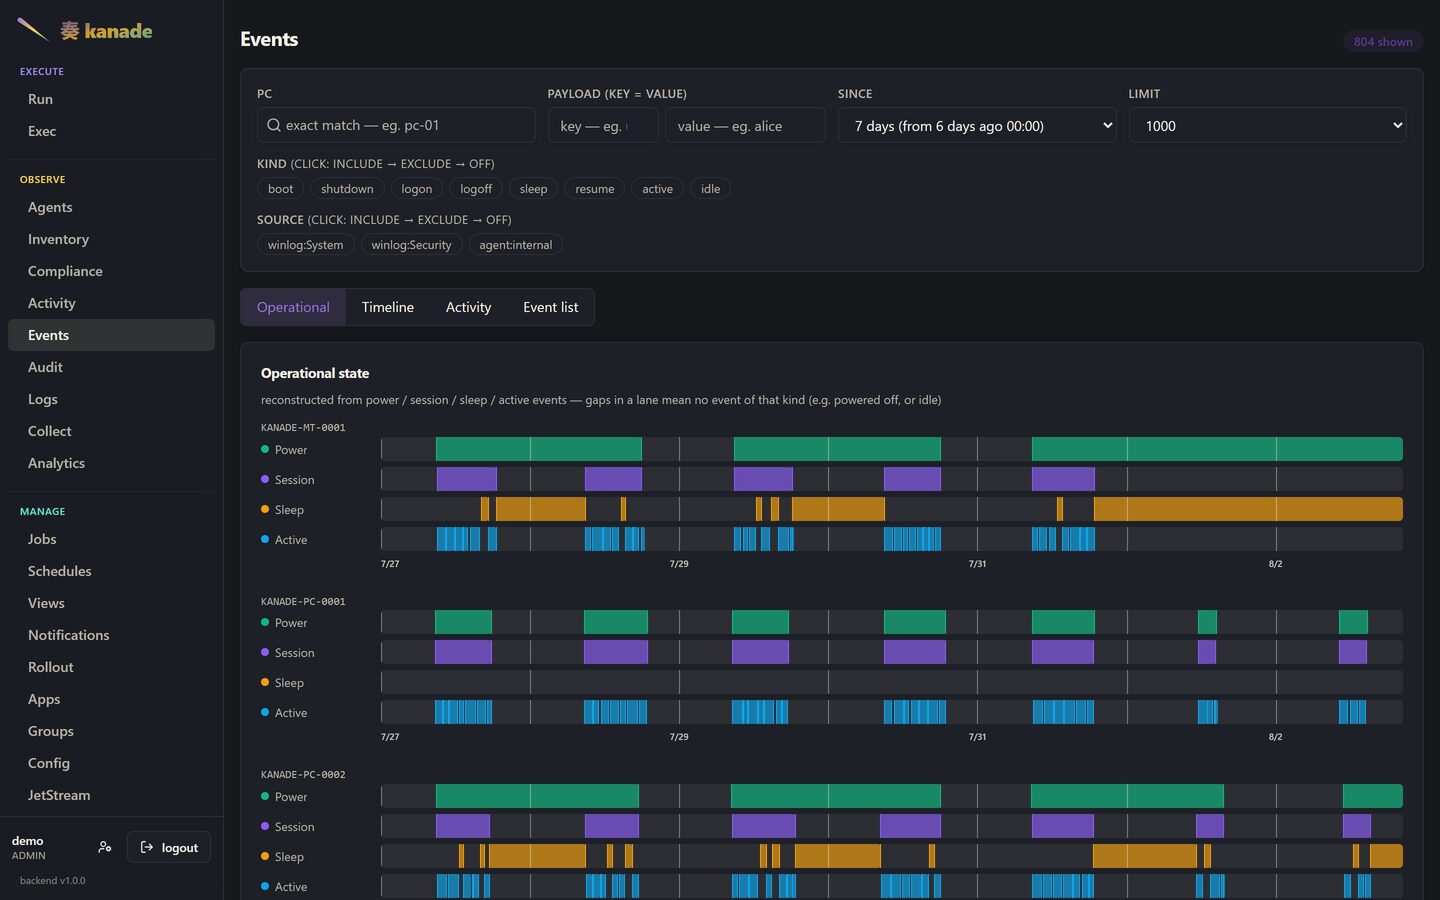
Power, session, sleep and active intervals reconstructed from Windows event log entries, one lane per kind. A blank lane means no event of that kind in the window — the machine was off, or idle.
Analytics
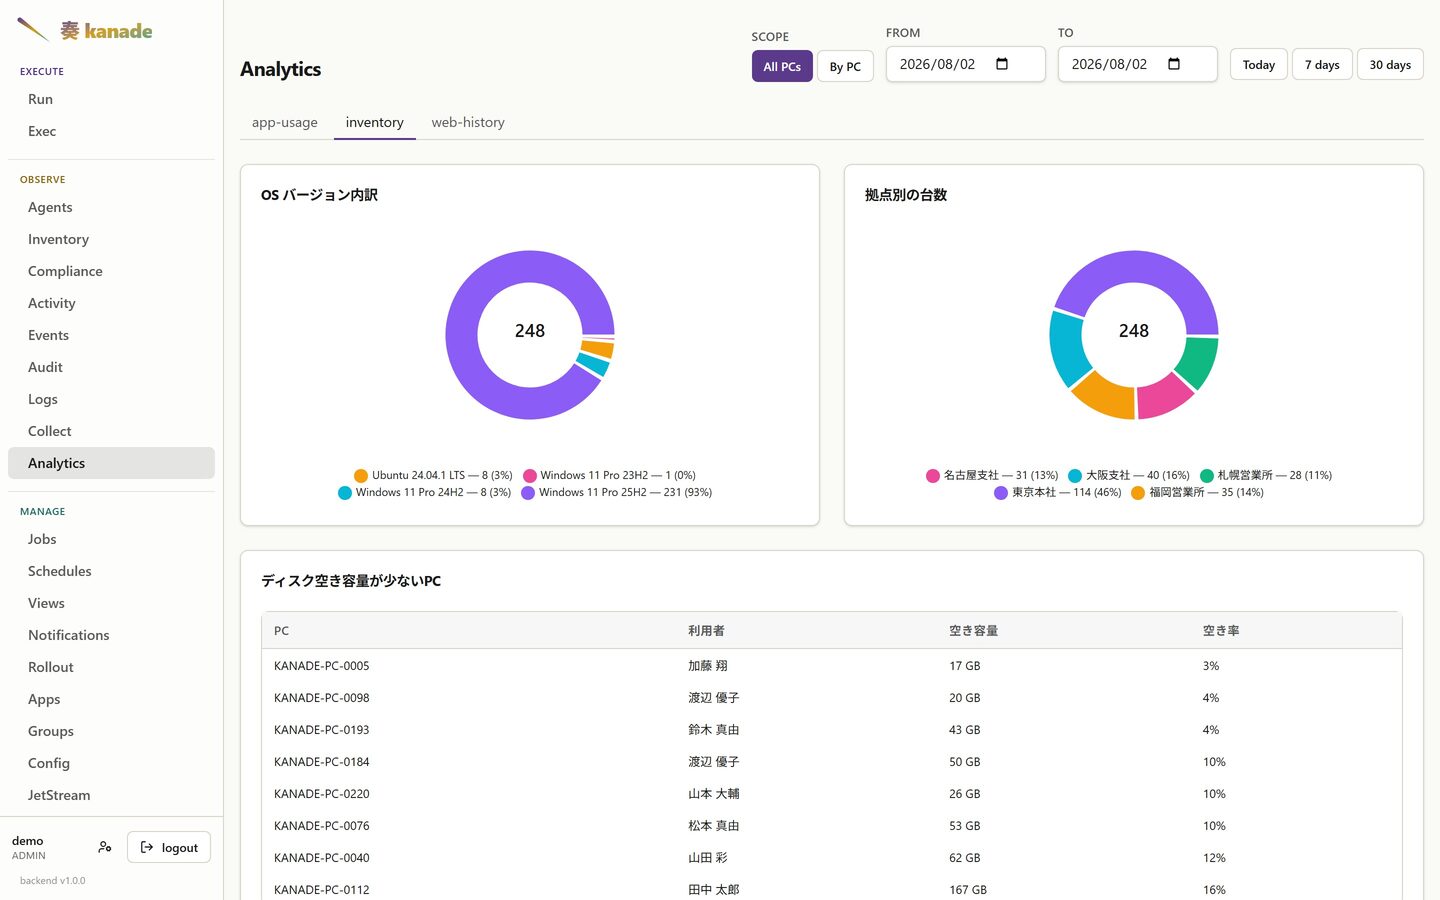
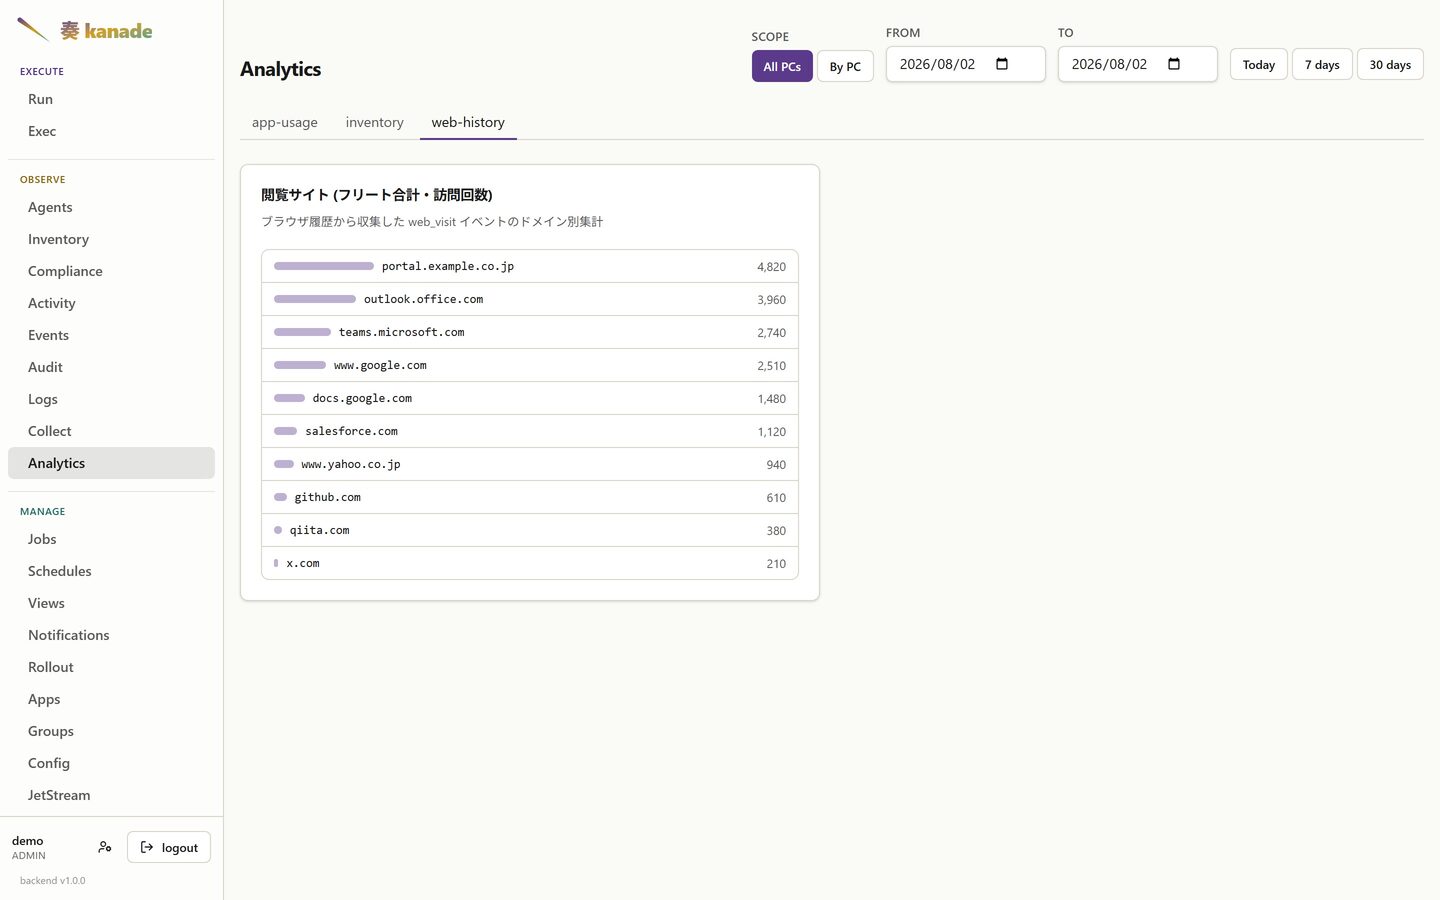
Aggregations over whatever your jobs emit. App-usage, browsing history and inventory facts are shown here; the widgets are defined in YAML and can be pinned to the dashboard.
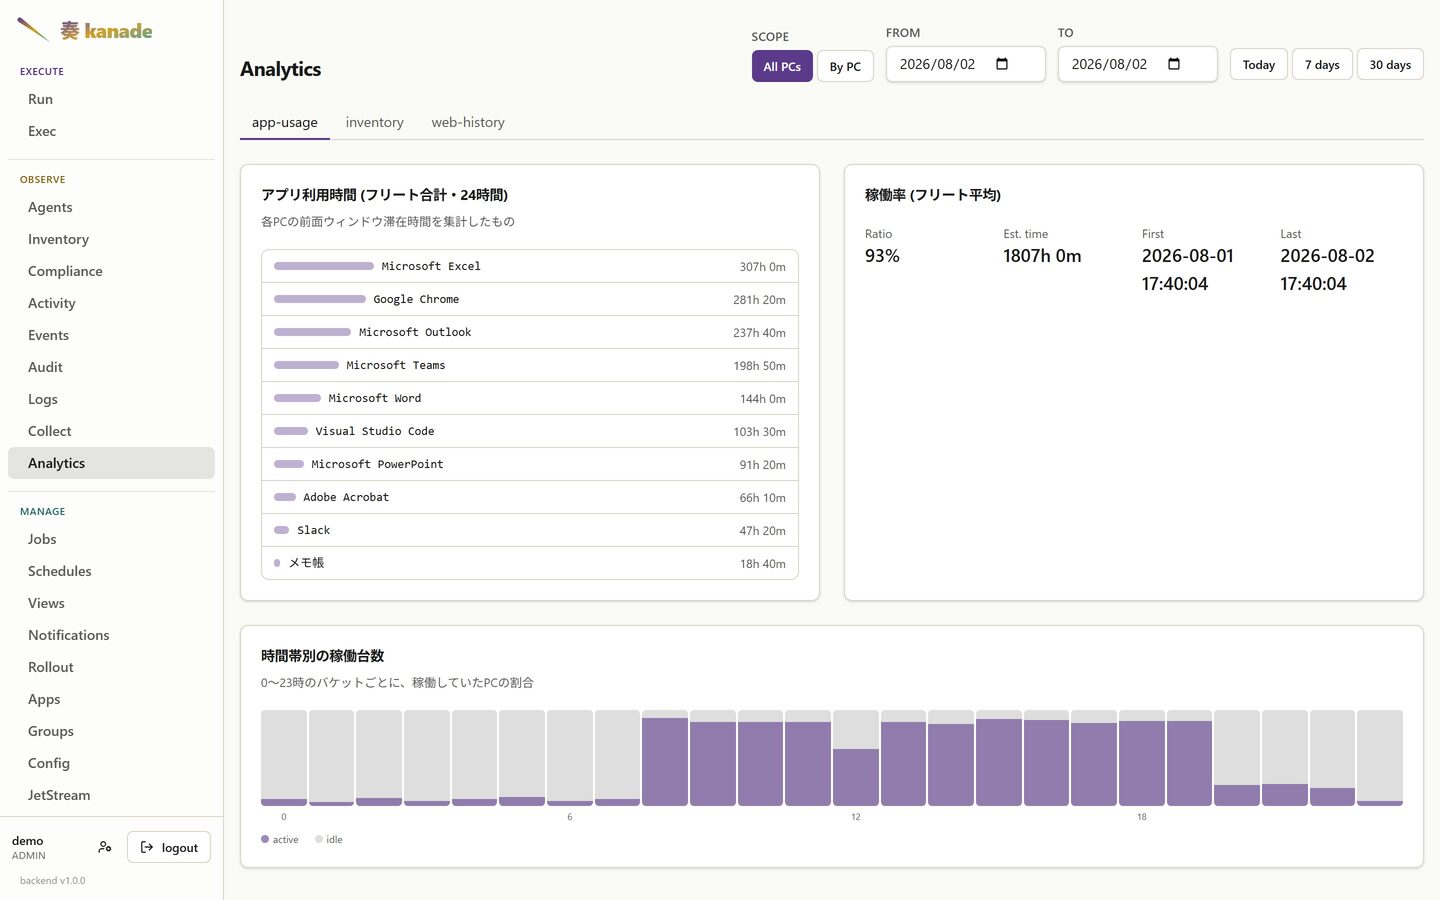
The tabs are not a fixed set of reports — each one is a dashboard: name
some manifest declared, so a new tab appears by writing a widget that claims
it. These two came with the fixture:
Groups
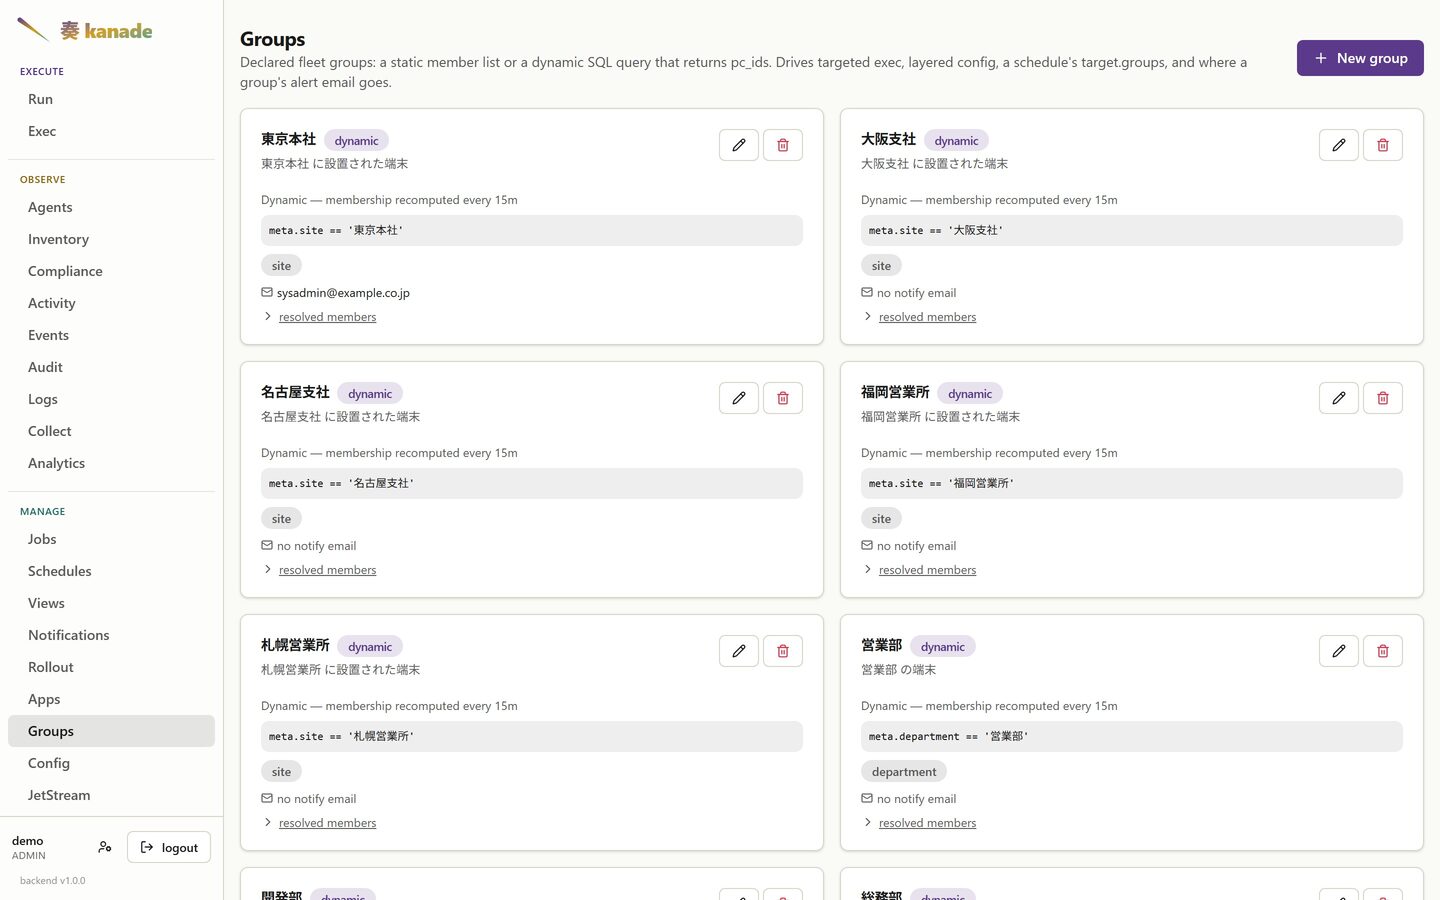
Declared fleet groups. A dynamic group carries a query the backend
re-evaluates on a schedule, so membership follows the fleet as metadata
changes — stamp site and department onto an agent once, and a PC that
moves office lands in the right groups by itself. A static group carries a
literal member list, for membership no query can express.
Notifications
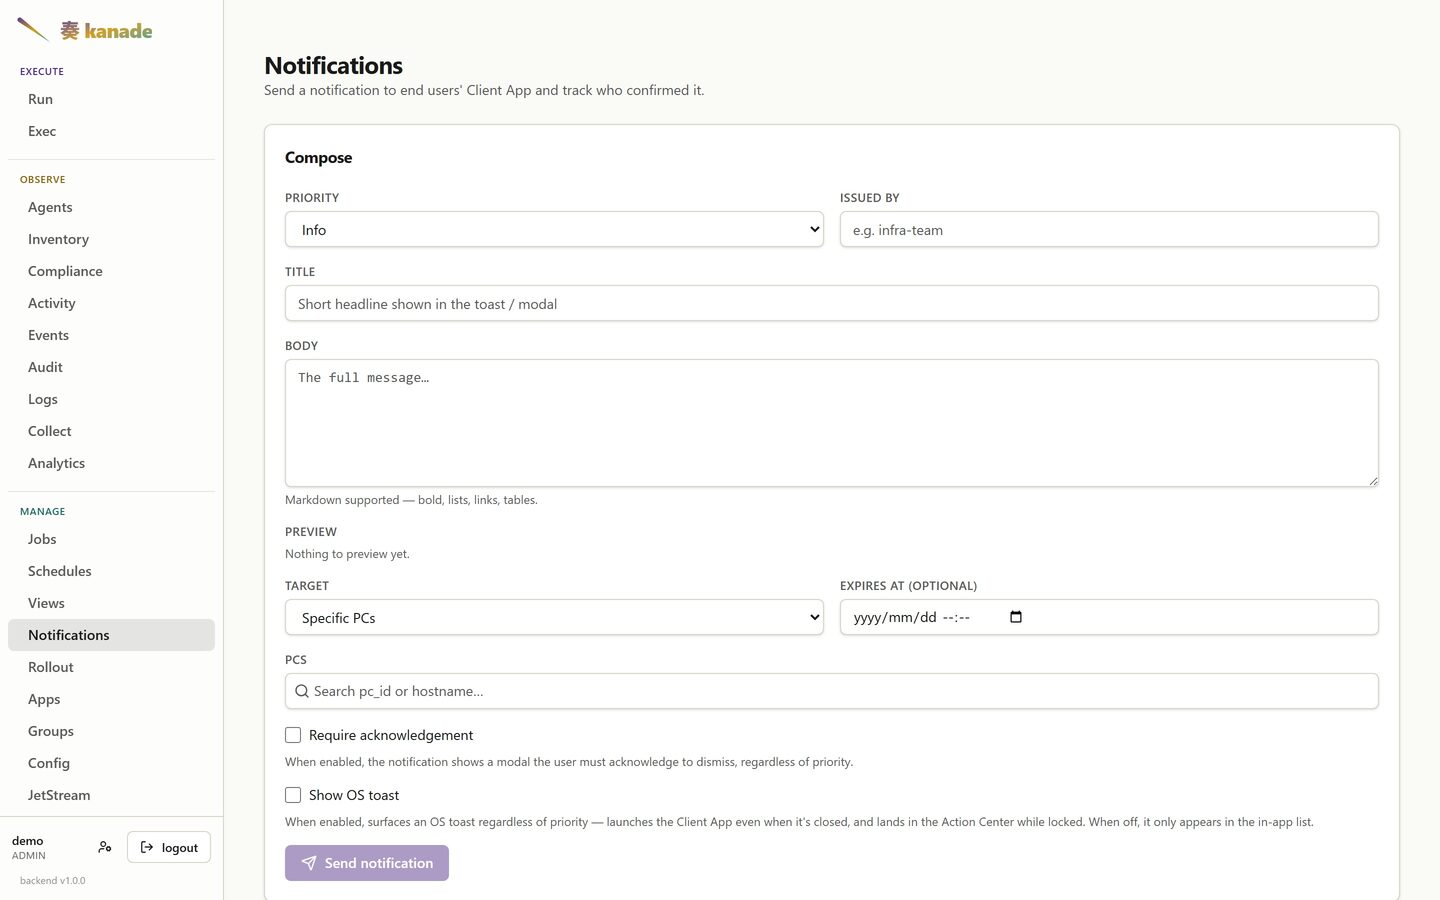
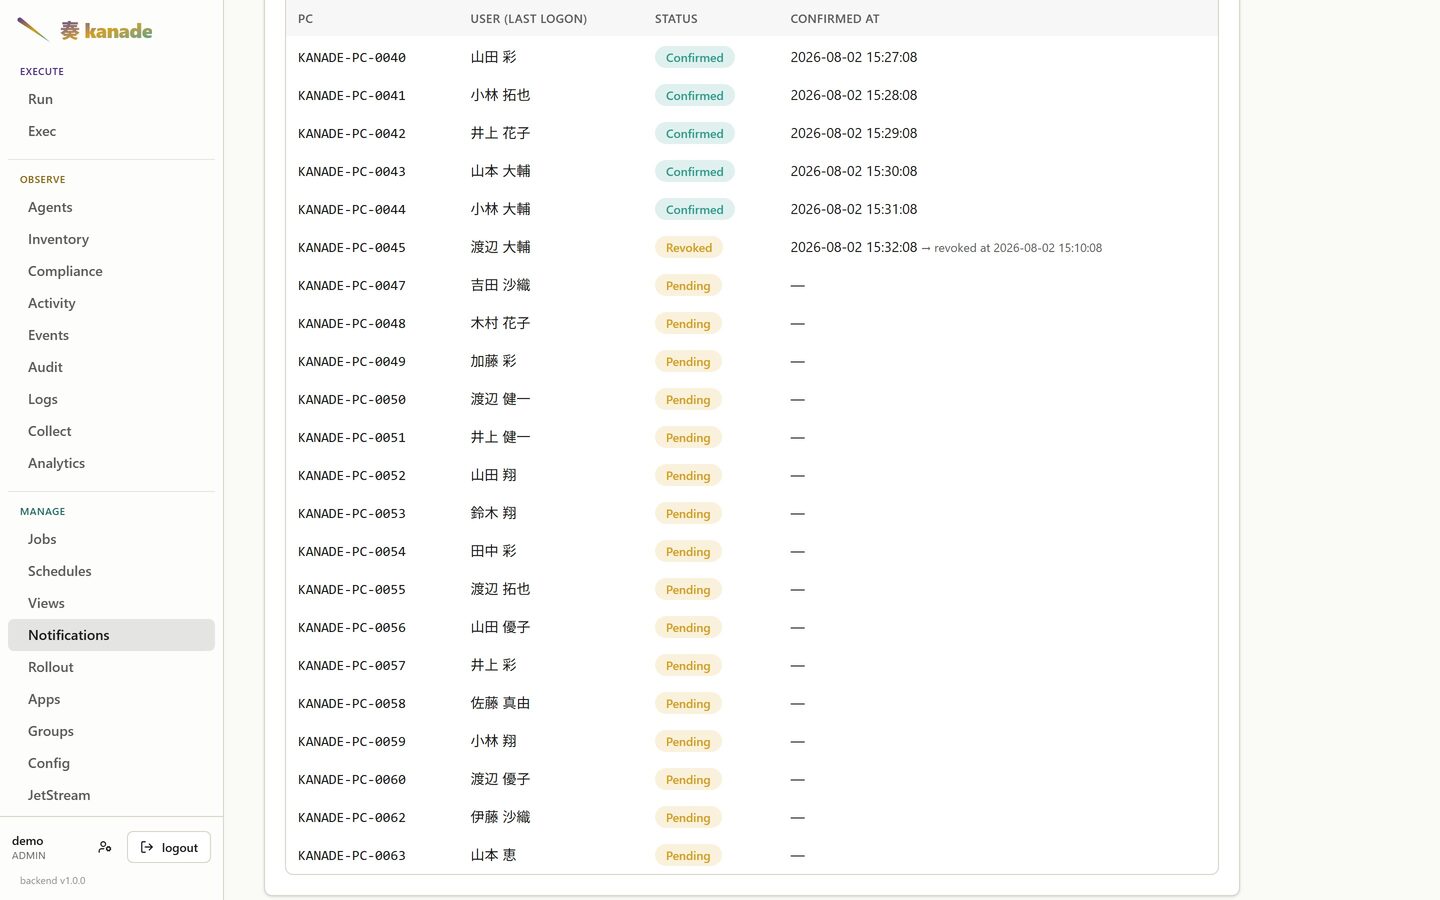
Send a notice to the Client App and track who confirmed it. Bodies are Markdown — headings, lists, tables, links — so a fleet-wide notice can be a document rather than a paragraph.
Who confirmed, and who took it back
Opening a notice tracks it per recipient, against the person who was signed in on that machine. Three states, not two: confirmed, still outstanding, and withdrawn — someone who confirmed and then took it back. A withdrawn row keeps both times, so "everyone has read it" cannot quietly become true again after the fact.
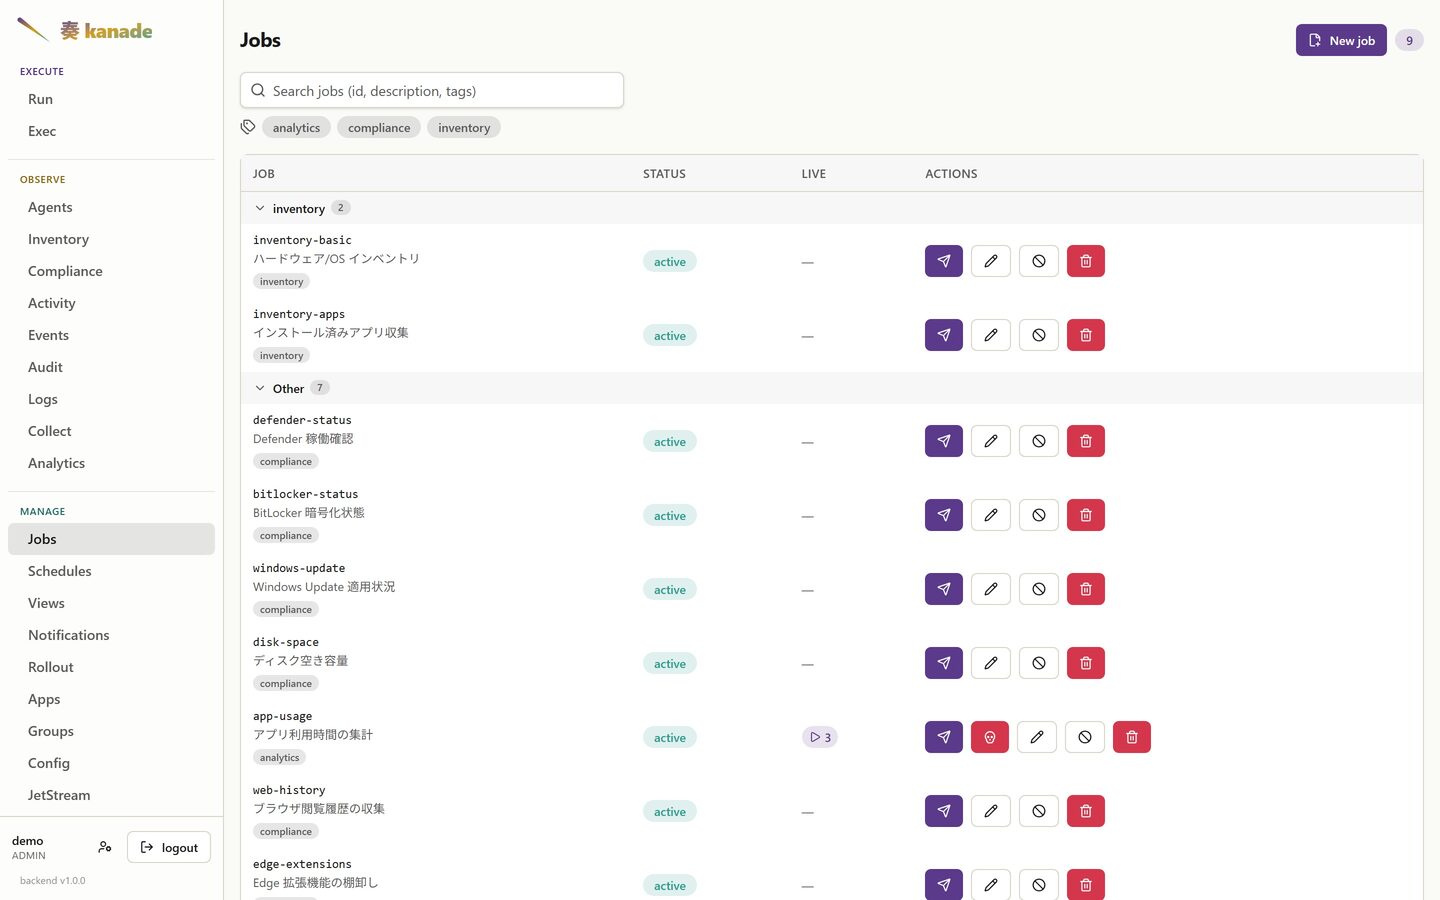
Jobs
The manifests themselves, grouped by tag. Everything kanade runs on an endpoint is one of these.
The manifest itself
Opening one shows the YAML an operator wrote, not a form generated from it. Comments and block-scalar indentation survive the round trip, because the source is stored verbatim rather than re-serialised from a parsed object — so the file you get back is the file you saved. The editor knows the schema: hovering a field name shows what it does.
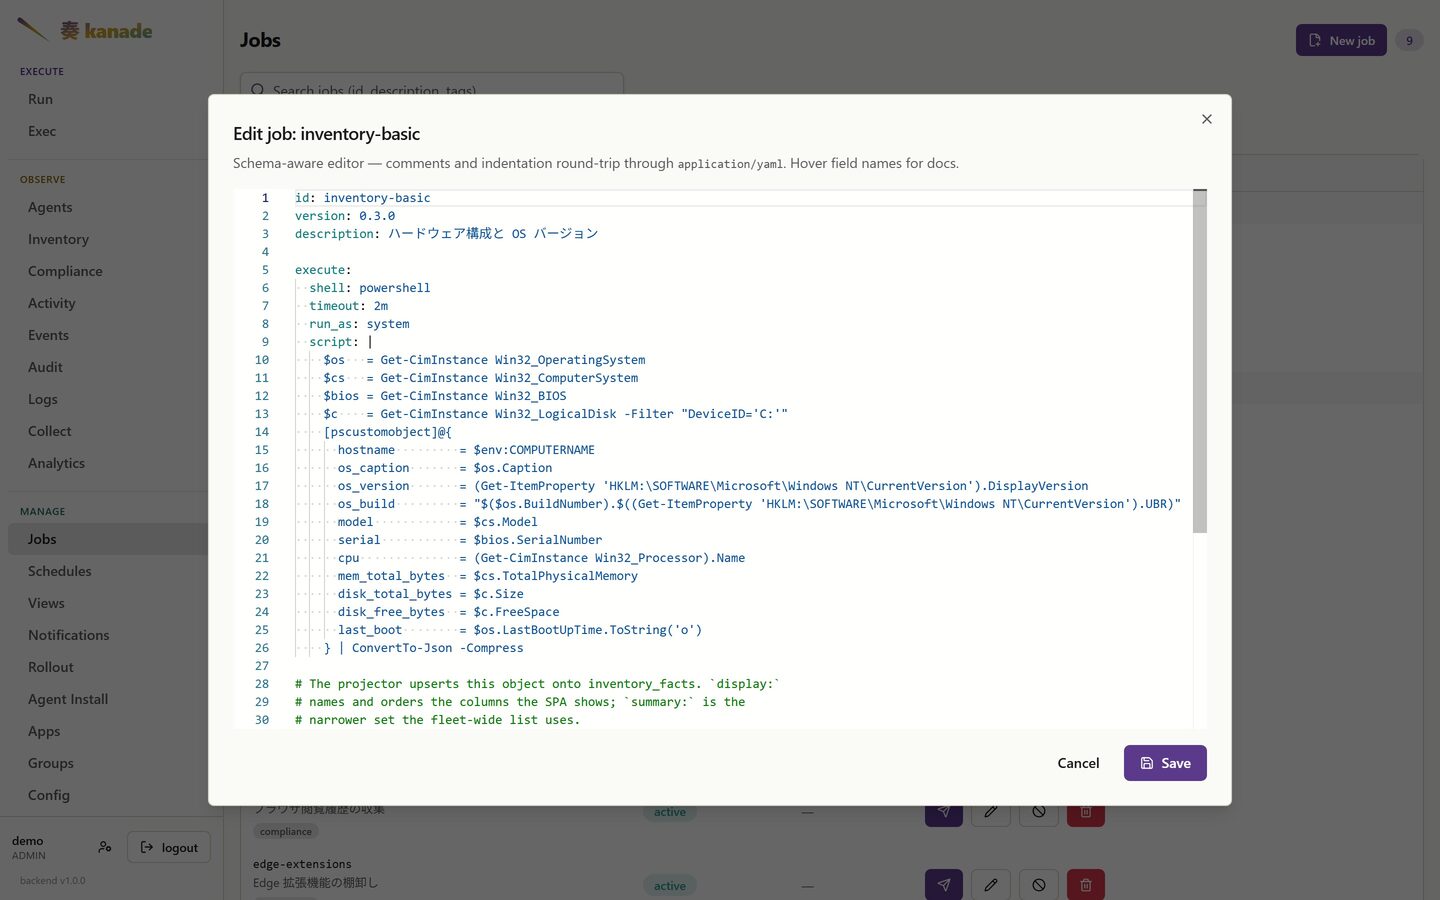
A manifest kept in Git opens read-only instead, pointing at the path in the repository — the SPA will not let an edit here diverge from the source of truth.
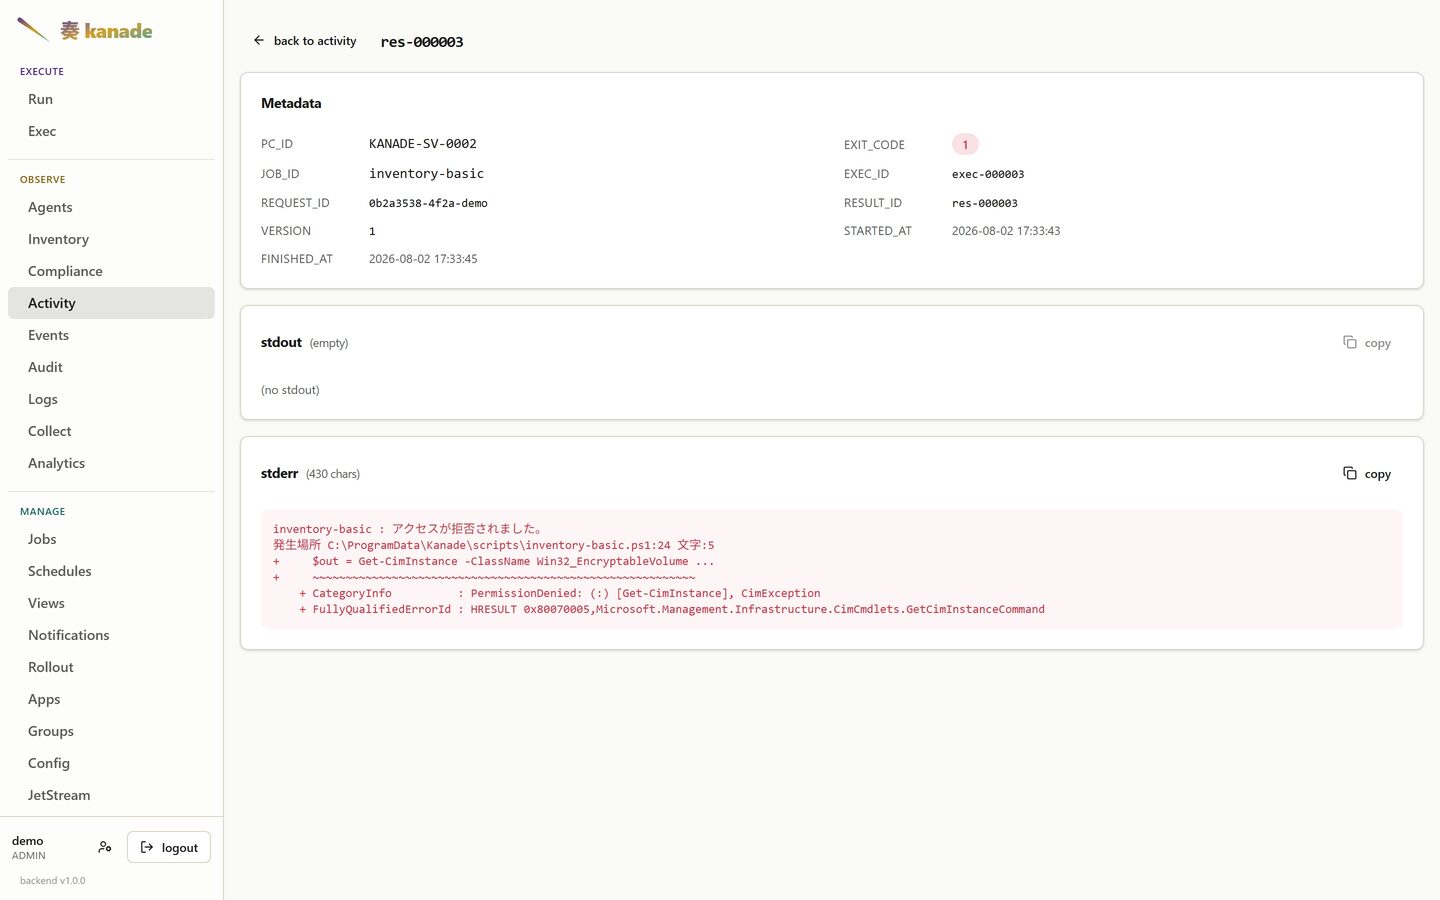
One run
Every dispatch keeps its own result: the exit code, the ids that tie it back to the job and the request, and the output exactly as the host produced it. A failure is worth more than a red badge — this one carries the PowerShell error that caused it.
Audit
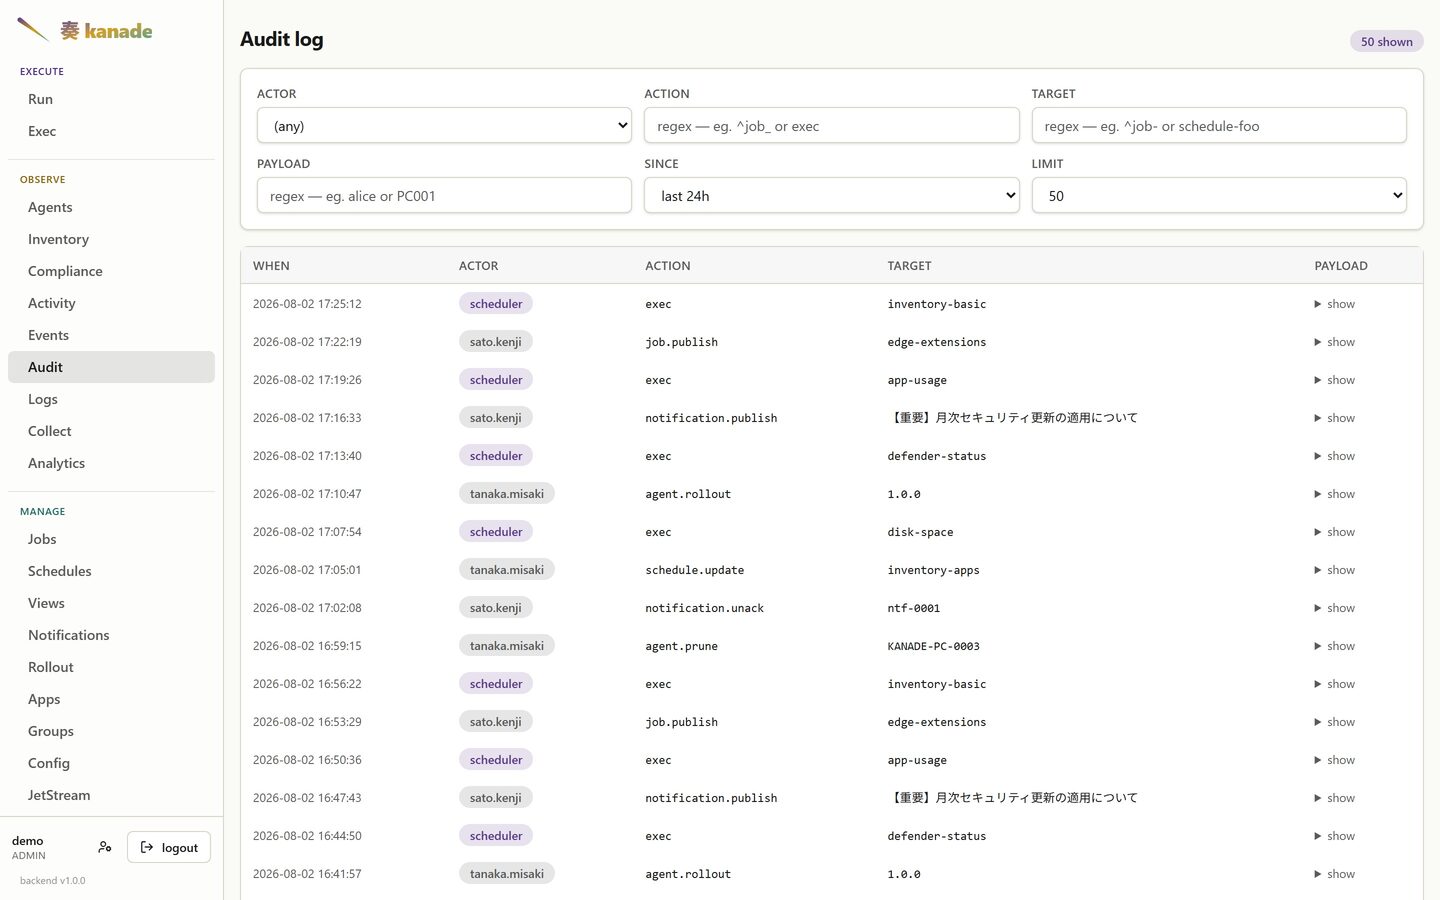
Every dispatch and every operator action, with the payload behind each one. Filterable by actor, action, target, and a text search into the payload itself.
Accounts
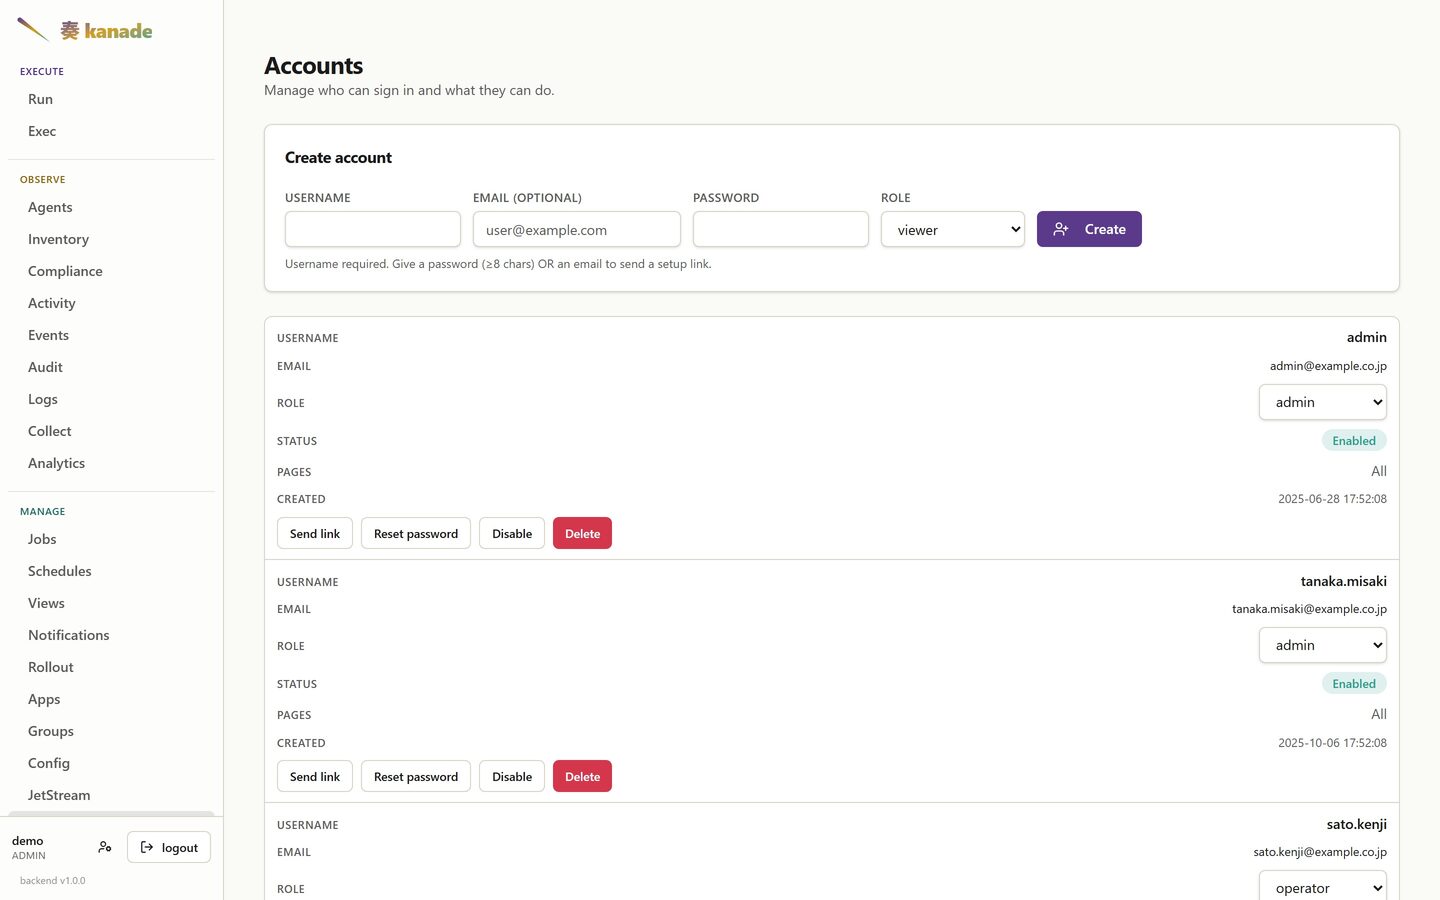
Operator accounts and their page access. Three states are visible at once here, because they are easy to confuse: unrestricted, a per-account allow-list, and a shared permission group — where the group governs and the account's own list, if any, no longer applies.
Your own account
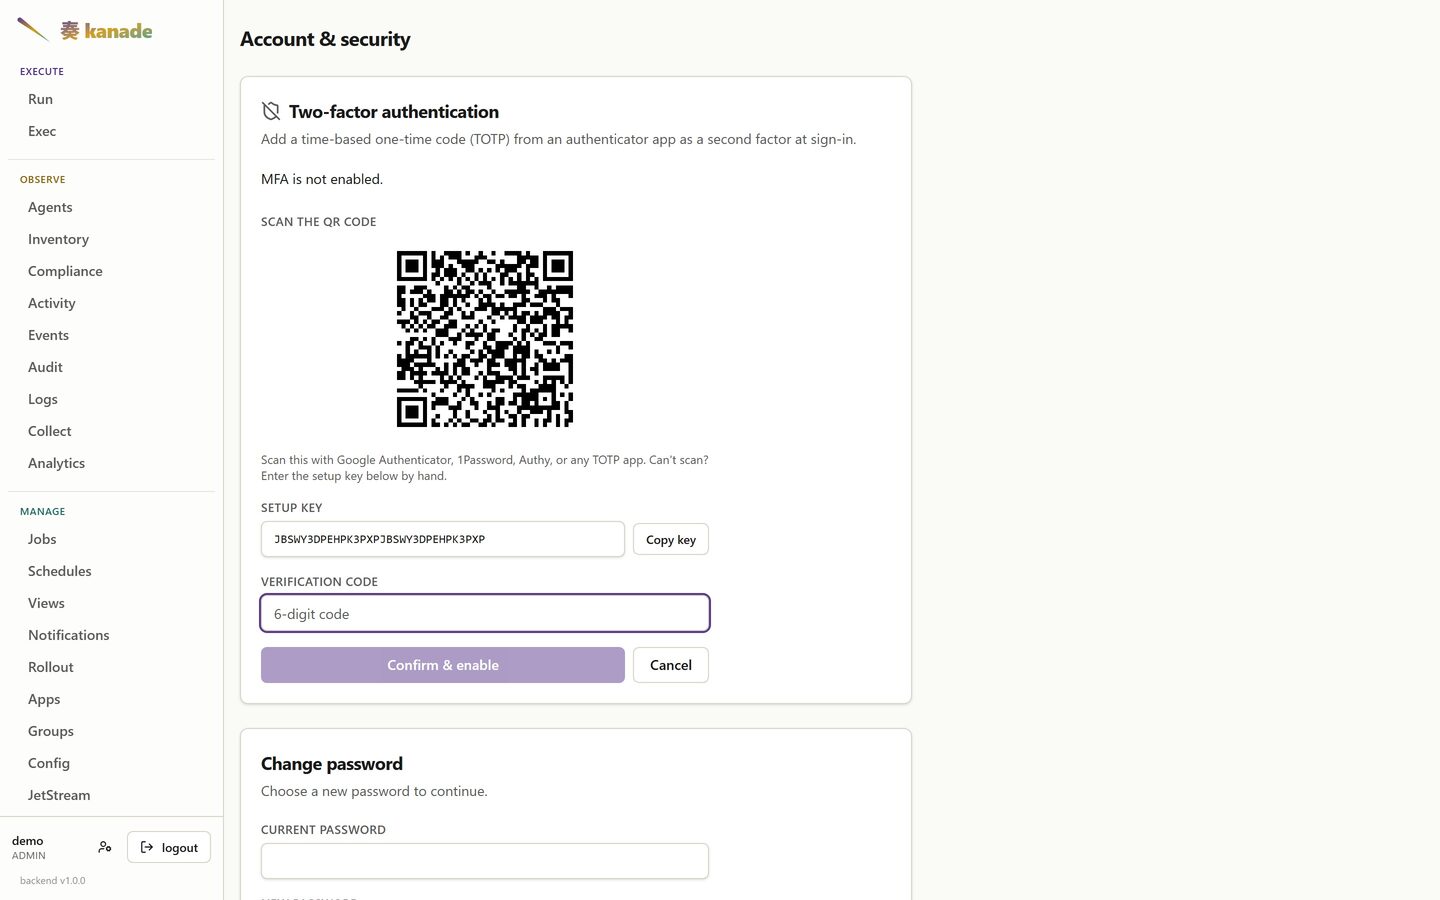
Two-factor auth and the password sit on one self-service page, so an operator sets both up without an administrator in the loop. Enrolment is ordinary TOTP — scan the code with any authenticator, or type the setup key in by hand. The candidate secret is only stored once a live code confirms it, so an abandoned enrolment leaves the account exactly as it was.
JetStream
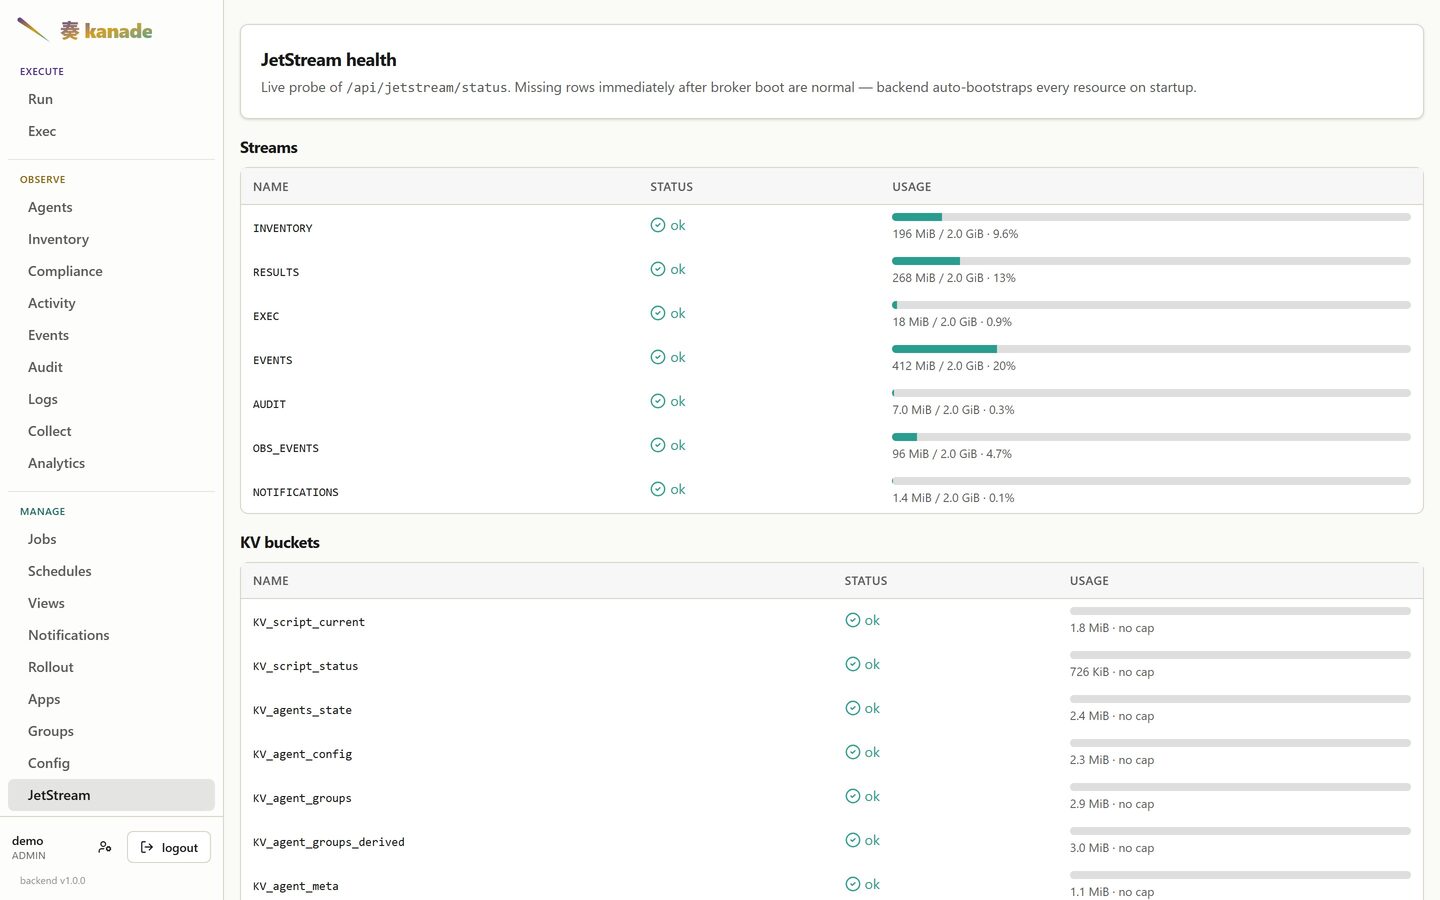
The broker's own health: every stream, KV bucket and object store the backend bootstraps, with usage against its limit.
Dark theme
The console follows the operating system by default, and can be pinned to light or dark per browser.
 |  |
 |  |
On a phone
Below 1024px a data table stops being a table: each row becomes a card and every value carries its column name. No horizontal scrolling, no pinch-zoom to read a cell.
 |  |  |
The Client App
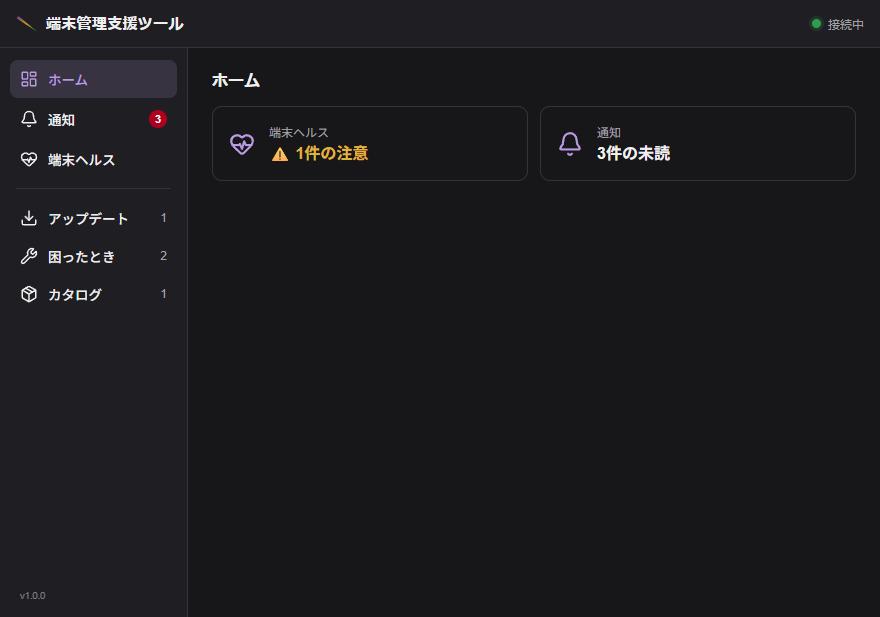
The half that lands on the end user's desk. It is a small tray application on the PC itself — the health tab they check, the jobs they can run without raising a ticket, and the notice they have to confirm. It talks to the agent over a named pipe on the same machine; it never reaches the backend directly.
These are shown at 880×560, the app's own window size, and in Japanese only: the Client App has no i18n layer — its strings are written into the source — so an English edition of these shots does not exist to capture.
Opening on the two things the user is being asked to look at:
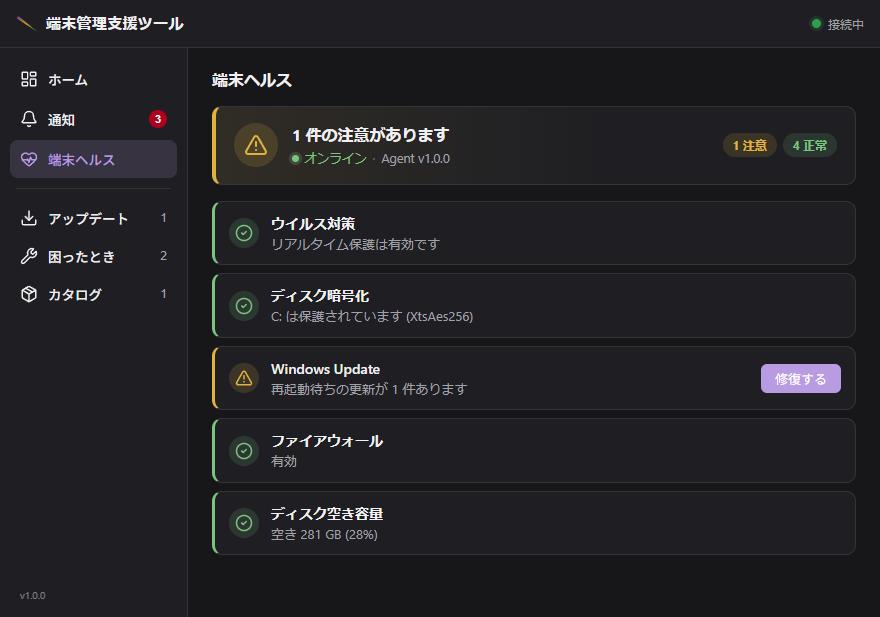
Device health
The same checks the operator sees on the Compliance page, from the other side. A warning carries the operator's own explanation and the remedy, so the first move is not "open a ticket".
Notices
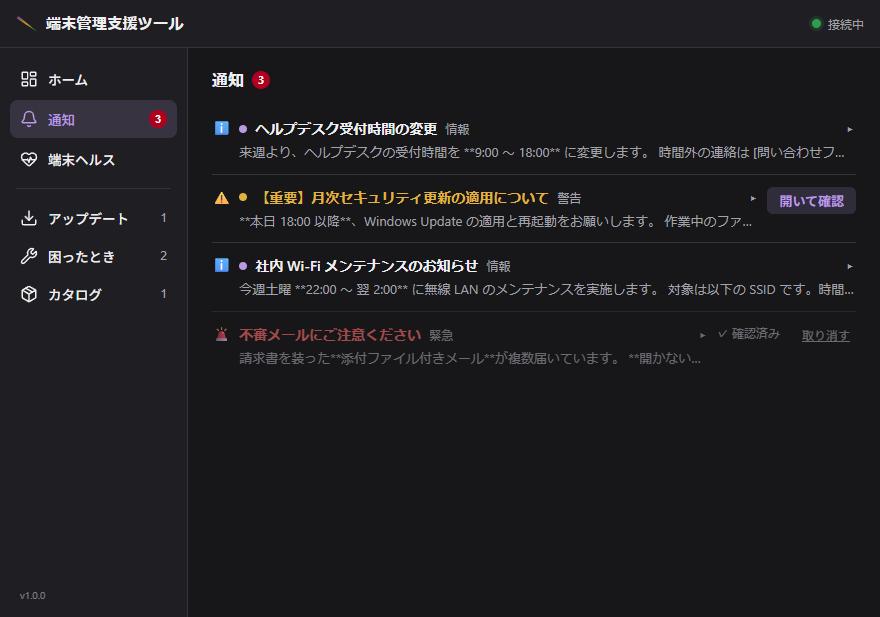
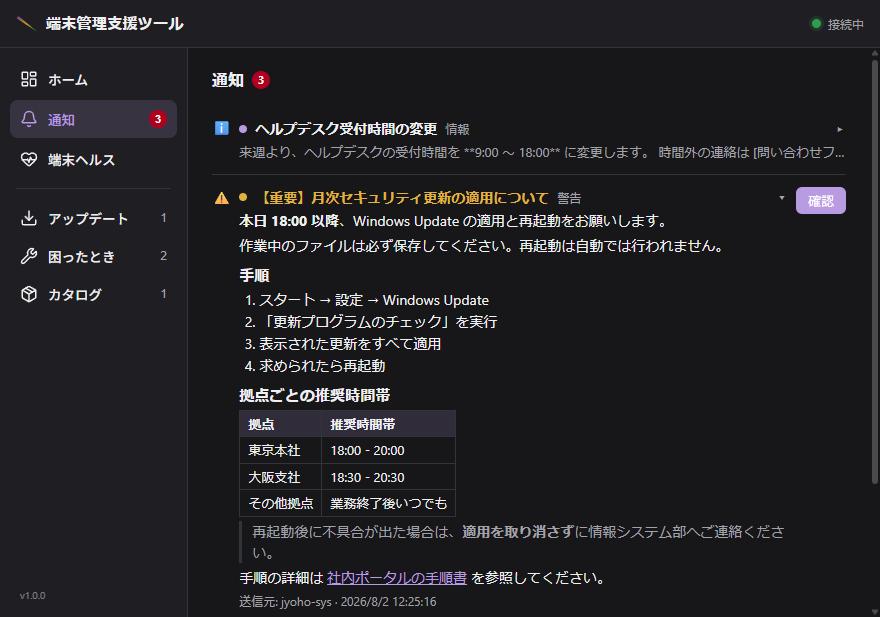
Sent from the Notifications page, tracked back to who confirmed. Expanding one renders the Markdown the operator wrote — headings, a numbered procedure, a table, a quote, a link:
Self-service
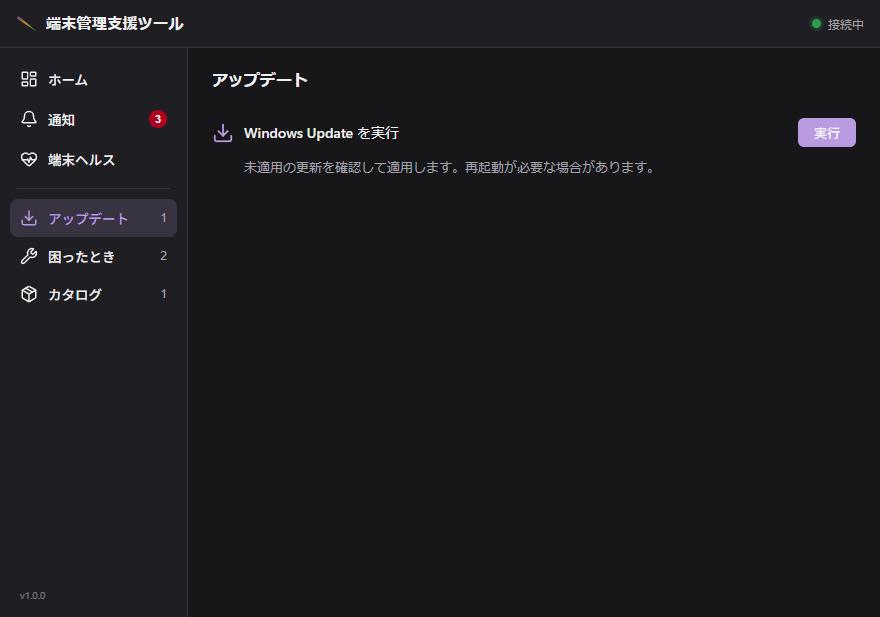
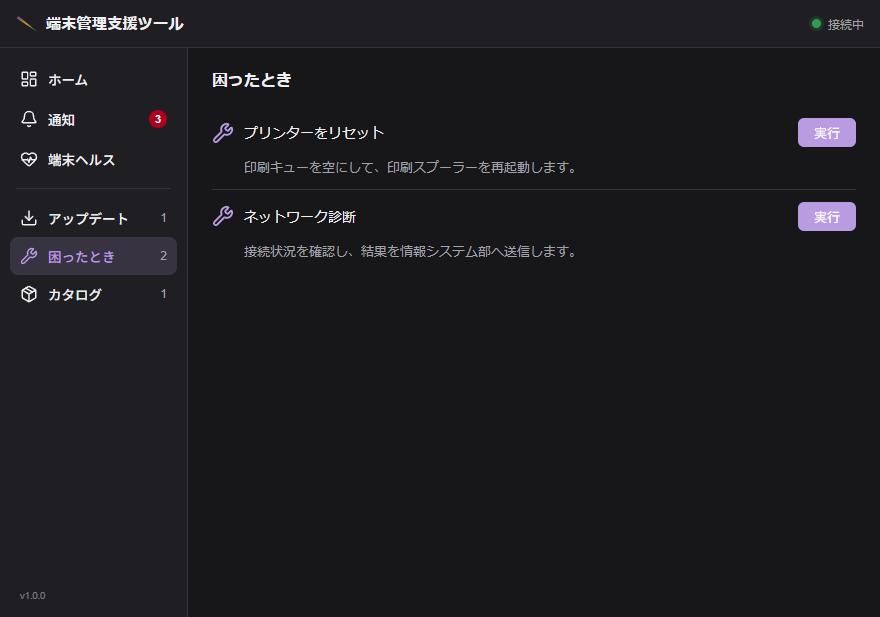
Jobs an operator has published to the user, grouped by category. Each is an ordinary manifest; what makes it appear here is the operator deciding it should.
 |  |
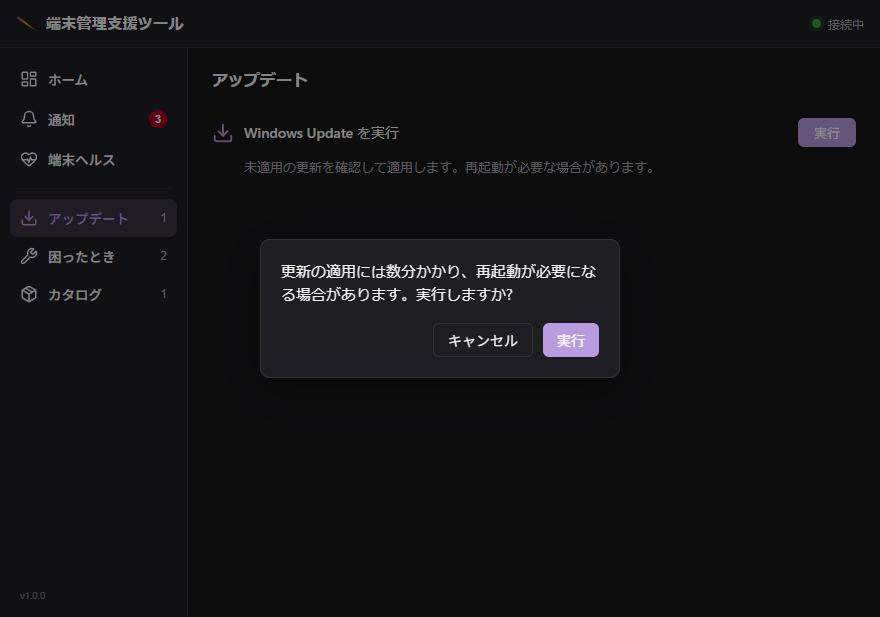
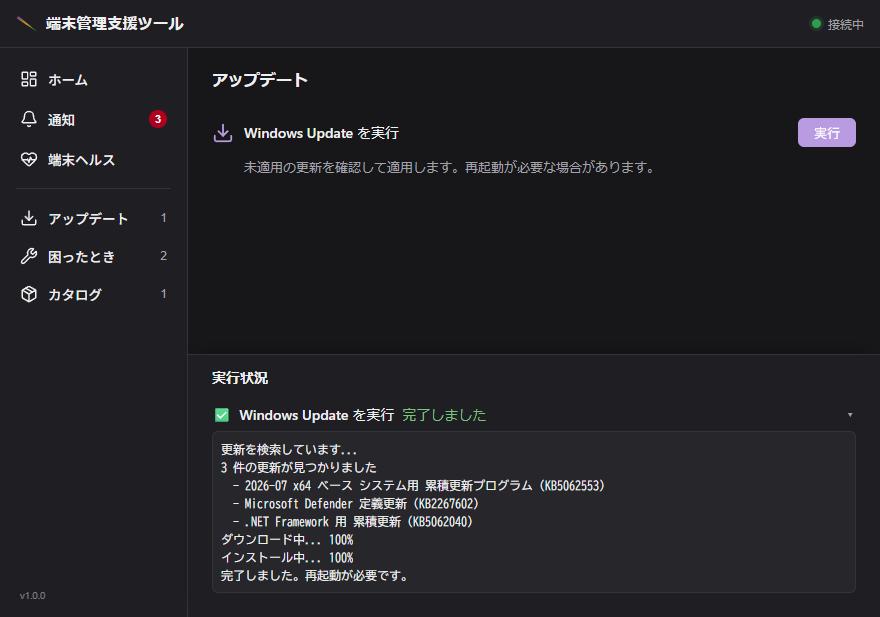
A job can ask before it runs — confirm: in the manifest, with the
operator's own wording — and the run streams its output as it goes, rather
than appearing complete after a silence:
 |  |
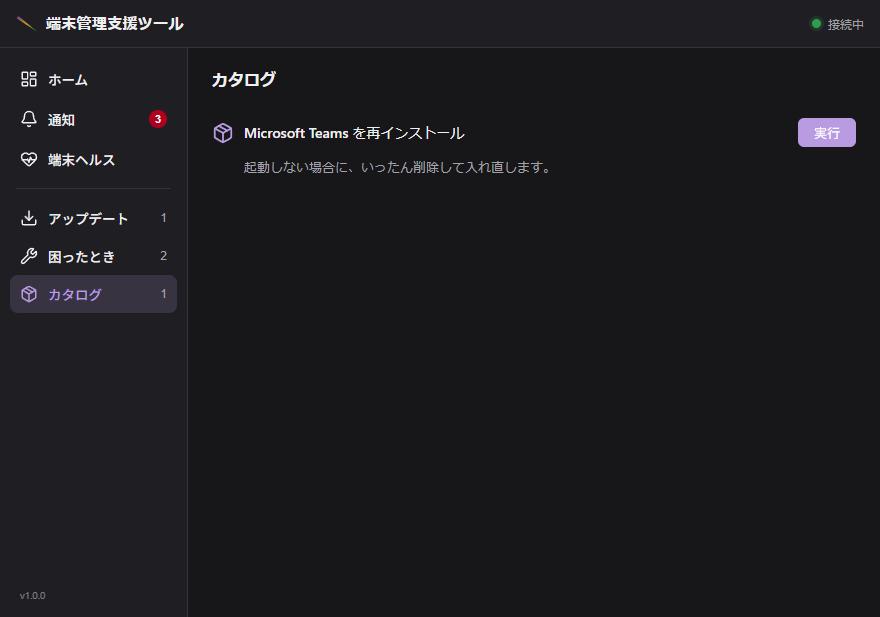
The catalog is the same mechanism pointed at installs:
Running it yourself
cargo make demo         # the operator console
cargo make demo-client  # the Client App
Then open http://localhost:5173 and sign in with any username and password.
Nothing else needs to be running. See
crates/kanade-backend/web/demo/README.md for what the mock covers and how to
add to it.